
- HYPE price remains within a rising channel, with buyers defending support levels during recent pullbacks.
- U.S. spot HYPE ETFs recorded $100.48 million inflows and zero outflow days during the first 11 sessions.
- Rising volume and sustained ETF demand continue supporting HYPE’s bullish market structure.
HYPE price remained firm near key resistance levels as strong ETF demand and sustained buying activity supported market sentiment. Recent trading data showed continued strength while investors monitored a potential breakout.
HYPE Price Tests Upper Boundary of Ascending Channel
A recent chart shared on X showed HYPE maintaining a clear ascending channel. Price action continued forming higher highs and higher lows throughout the trend. Buyers remained active near support during every notable retracement.
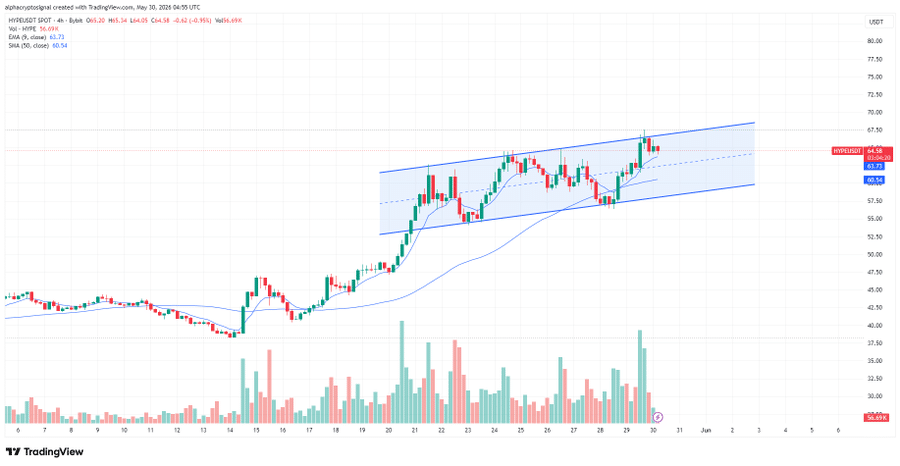
The structure gained attention as HYPE approached the channel’s upper boundary. Market participants watched closely for confirmation above resistance levels. A successful breakout could trigger increased momentum in coming sessions.
Price also remained above a rising 9-period EMA throughout the advance. The moving average continued acting as dynamic support during pullbacks. This behavior reflected steady participation from trend-following traders.
Trading activity near resistance became a focal point for short-term analysis. Previous tests of the upper boundary produced temporary declines. However, the broader structure remained intact while channel support held.
Volume Growth Supports Recent Market Strength
HYPE as of the time of writing, was trading around $66.35 during the latest session. The move represented a gain of roughly 6% over 24 hours. Buyers pushed prices higher following a sharp breakout from lower levels.
The strongest move occurred after HYPE advanced from the $62 range. Price rapidly climbed above $65 before approaching $67 resistance. Strong buying activity accompanied the upward move.

Importantly, the rally was followed by consolidation instead of heavy selling. HYPE established support between approximately $64.50 and $66.00. Buyers repeatedly stepped in when prices softened.
Trading volume increased more than 35% during the period observed. Daily turnover reached approximately $1.37 billion across exchanges. Higher volume alongside rising prices often signals stronger market participation.
Spot ETF Demand Adds Institutional Support
A separate market update, showed U.S. spot HYPE ETFs crossing $100 million. Total cumulative inflows reached $100.48 million after 11 trading days. The figures covered activity between May 12 and May 28.
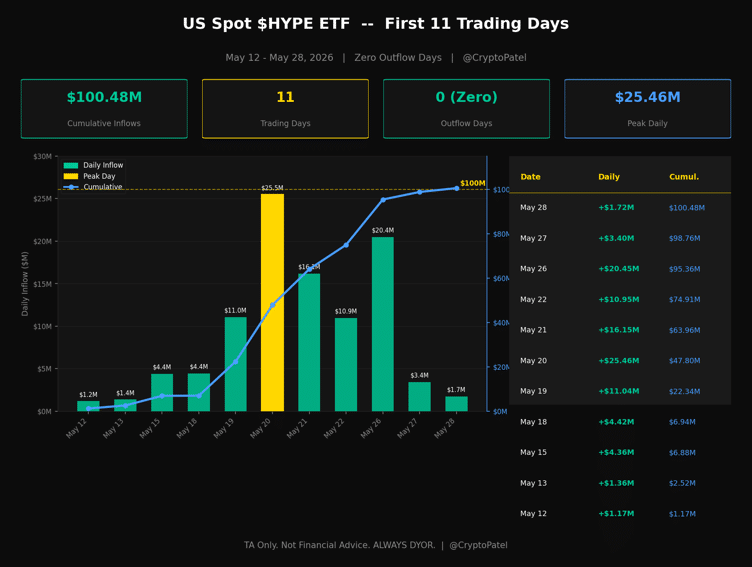
The ETF launch recorded zero outflow days during the period. Every trading session generated positive net inflows from investors. Consistent demand remained one of the most watched metrics.
Inflows accelerated noticeably after the first week of trading. The largest daily addition reached $25.46 million on May 20. Another strong session added $20.45 million on May 26.
The cumulative inflow curve continued rising throughout the launch period. Demand did not fade following the strongest accumulation sessions. As a result, ETF participation became an additional factor supporting the broader HYPE price trend.