
- Ethereum dropped toward $2,172 after breaking below support zones between $2,300 and $2,240.
- Analysts disagreed, with some calling for further downside while others predict a major bullish rebound.
- Technical indicators like RSI and MACD show oversold conditions but sustained bearish momentum remains.
Ethereum slipped further below key price levels, as analysts Ali, Ted, and Javon Marks outlined diverging technical outlooks. The asset traded near $2,172 after a mild decline, while charts showed weakening momentum and sustained selling pressure across recent sessions. The move followed repeated breakdowns below prior support zones between $2,300 and $2,240.
Analysts Highlight Conflicting Ethereum Levels
Ali stated Ethereum has returned to the bottom of its trading channel, watching for a potential move toward $2,280 or $2,390. However, Ted noted ETH dropped below $2,200 and flagged $2,150 as the next critical support level. He added that losing it would be negative for Ethereum.
Meanwhile, Javon Marks reported a hidden bullish divergence on ETH. He projected a potential recovery move exceeding 110%, with targets above $4,811 and extended levels near $8,500. These contrasting views reflect different interpretations of current price behavior.
Price Action Shows Sustained Downside Pressure
Ethereum’s recent structure showed an early consolidation phase before a shift toward lower highs. The asset previously peaked near $2,360 before losing momentum. It then broke below multiple support zones, accelerating the decline toward the $2,170 range.

Notably, trading data recorded stronger selling activity during breakdowns, with increased red candlesticks and volume spikes. The RSI 14 fell to 23.82, placing Ethereum deep in oversold territory. The RSI moving average stood near 36.09, confirming weakening momentum conditions.
Indicators Point to Oversold Market Conditions
The MACD remained negative, with the signal line positioned above the MACD line. The histogram held near -3.97, reinforcing ongoing downside pressure across short-term sessions.
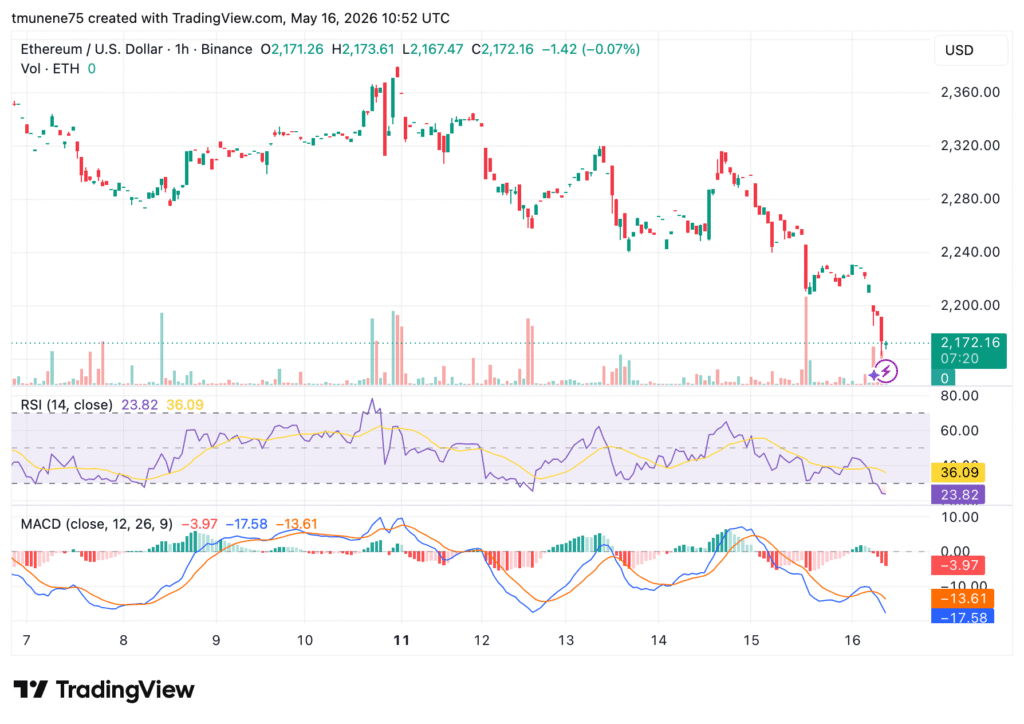
Key support levels now is near $2,160 and $2,120, while resistance zones remain at $2,200 and $2,240. Price action between May 7 and May 16 reflected repeated rejection attempts at higher levels before the latest decline.