
- Analyst outlines a corrective structure, expecting a wave B move that could push Bitcoin toward the $87,000 zone.
- Short-term price action shows higher highs and lows, supported by rising volume and a bullish MACD crossover.
- Key resistance is between $80K and $82K, while support remains at $78.5K and $77K.
At press time, Bitcoin was trading at $79,953 with analyst Darkfost outlining a corrective structure shaping price action. He shared the outlook while reviewing daily and weekly trends, noting BTC remains below its 200-day EMA at $82,130. According to Darkfost, the market now approaches a short-term pivot as momentum indicators show mixed signals.
Analyst Maps Corrective Structure and Key Levels
Notably, Darkfost said Bitcoin remains in a long-term corrective phase. He confirmed that wave A has already completed within this structure. However, he expects a wave B move to unfold next, likely forming in five legs.
According to his analysis, a 50% retracement of wave A points to a zone near $87,000. He added that this move could develop through a short squeeze driven by excessive bearish positioning. Meanwhile, he identified $93,500 as a level that would confirm a broader trend reversal on a weekly close.
Price Action Builds Short-Term Bullish Momentum
At the same time, recent price action shows a shift toward a short-term uptrend. Bitcoin formed higher lows and higher highs beginning May 1. This structure followed a consolidation phase between $75,500 and $78,500 during late April.

Moreover, buyers absorbed selling pressure near $75,000, forming a long downside wick. The price then advanced from around $78,000 to test the $80,000 level. Increased trading volume supported this upward move, indicating stronger participation.
Indicators Support Momentum but Resistance Holds
However, technical indicators present a balanced view near current levels. The Relative Strength Index is around 63, holding above its signal average near 62. This reading reflects moderate bullish momentum without reaching overbought conditions.
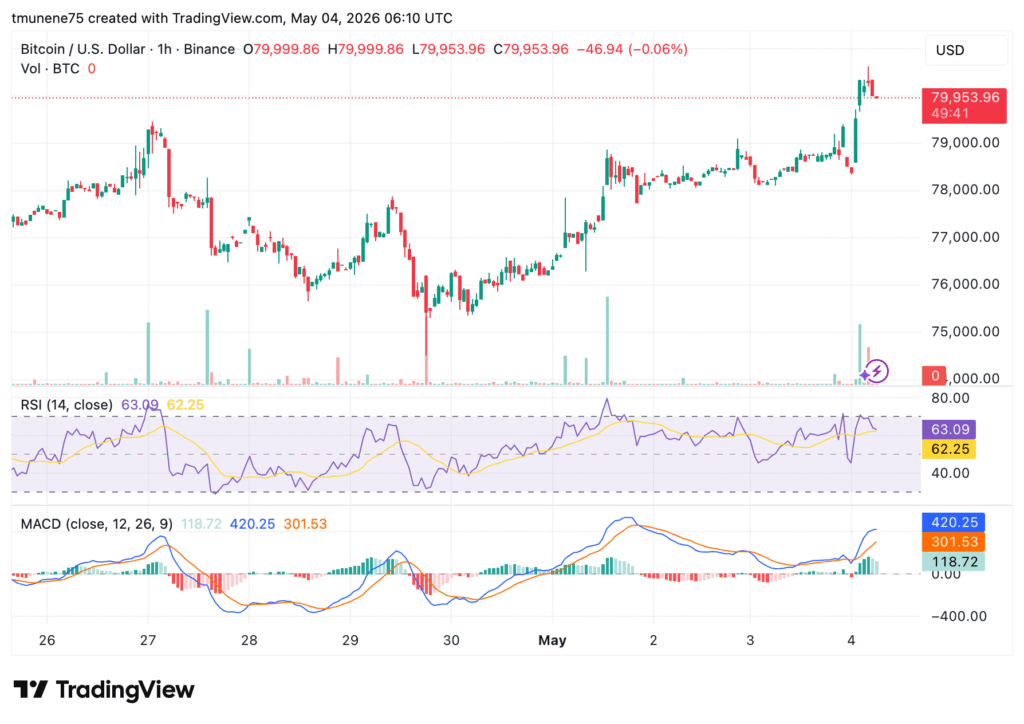
Meanwhile, the MACD shows a strong bullish crossover. The MACD line near 420 remains above the signal line around 301, with a rising positive histogram. Despite this, immediate resistance is at $80,000, followed by a range between $81,500 and $82,000.
On the downside, support levels remain at $78,500 and $77,000, aligning with earlier consolidation zones.