Key Insights
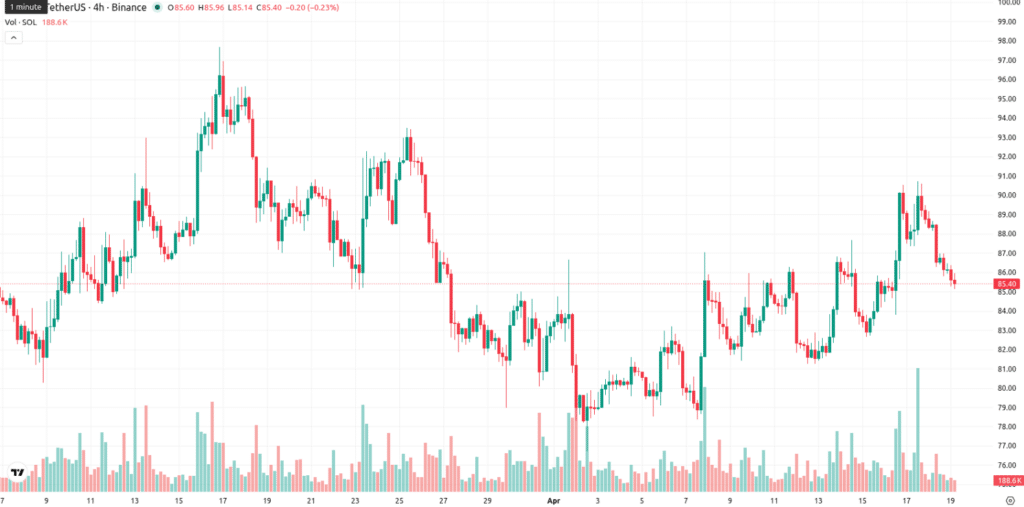
- Solana trades at $85.39 after a 3.50% drop, showing mixed signals as short-term support holds while a a long-term bearish trend persists.
- wXRP integration on Solana brings over $10million inon liquidity and strengthens cross-chain DeFi activity despite ongoing market selling pressure.
- Technical indicators remain weak as oscillators diverge, with SOL expected to trade between $82 and $88 amid limited upside probability.
Solana trades at $85.39 after dropping $3.10, marking a 3.50% daily decline as selling pressure intensifies. The asset sits just below its 50-day moving average, which signals resistance in the short term. However, it still holds above the 20-day average, showing limited support from recent buying activity.
Moreover, the broader trend remains weak as SOL continues to trade far below its 200-day moving average. This distance reflects sustained bearish pressure across longer time frames. Consequently, the market shows mixed signals, with short-term support failing to confirm any strong recovery.
wXRP Integration Expands DeFi Activity on Solana
Solana Foundation confirmed a direct purchase of wrapped XRP to support early-stage integration with Ripple. The transaction involved approximately 6,561 wXRP tokens, valued at $10,000, and took place on the Solana network. This step highlights ongoing efforts to expand cross-chain functionality within decentralized finance.
Additionally, the launch of wXRP comes with over $100 million in initial liquidity to strengthen adoption. Solana also led on-chain spot trading volume in the first quarter, capturing 41% of total activity. Hence, despite price weakness, network activity continues to grow steadily.
Momentum Indicators Signal Weak Directional Bias
Technical indicators show a lack of clear momentum, with MACD and ADX both reflecting neutral conditions. RSI remains near 51, indicating balanced market participation without strong buying pressure. However, other oscillators such as Stochastic RSI and CCI signal overbought conditions, which suggest potential downside risk.

Besides, Bollinger Band positioning indicates short-term buying pressure, even as price declines. This divergence highlights uncertainty in market direction. Consequently, traders remain cautious as indicators fail to align toward a confirmed trend.
Support Levels Face Pressure Near Key Zones
SOL trades close to its immediate support level around $85, with the Ichimoku Kijun line providing a nearby floor. The price action near daily lows reflects continued selling interest during trading sessions. Additionally, moderate volatility suggests controlled movement rather than sharp swings.
However, failure to hold above current levels may push the asset toward lower support zones. Market participants continue to monitor this area closely as it defines short-term direction.
Short-Term Outlook Favors Rangebound Movement
Over the next five days, SOL is expected to trade between $82 and $88, forming a tight consolidation range. The probability of an upward move remains below 20%, as multiple indicators favor sellers. Moreover, weekly signals continue to align with bearish conditions across major averages.
A move above $88 would require strong momentum confirmation to shift sentiment. Conversely, a drop below $82 may trigger further downside pressure and extend recent losses.