

- JasmyCoin faces bearish trends with immediate support at $0.02100 and resistance at $0.02500.
- Analysts project a potential 45-50% surge for JasmyCoin if it breaks key resistance at $0.02500.
- Technical indicators show bearish momentum for JasmyCoin, with low trading volume and a bearish MACD.
JasmyCoin (JASMY) is positioned for a notable uptrend, with potential for a 45-50% surge upon breaking out of its current downward channel, as analyzed by World Of Charts on Binance’s 4-hour chart. This analysis underscores the possibility of a significant price rally.
The price recently rebounded from the dynamic support level, suggesting strong support despite a downward correction. If the price returns to $0.02580, it might rise toward its previous high, indicating a strong new upward trend.
Currently, JasmyCoin’s immediate support stands at $0.02100, with resistance at $0.02500. Breaking through this resistance could lead to significant bullish gains. World Of Charts, projects a potential surge of 45-50%, targeting $0.04500. This potential breakout could yield an 86.34% increase, marking a bullish wave.
At present, JasmyCoin trades within a descending channel, suggesting a prevailing bearish trend. However, a recent breakout attempt indicates a possible trend reversal. Immediate support is around $0.02100, with secondary support at approximately $0.01750. Historically, these levels have provided price stability.
Immediate resistance is around $0.02500, aligning with the upper boundary of the downward channel. The secondary resistance level is approximately $0.03000, a significant previous high. Beyond these levels, the chart projects a potential target of $0.04500, representing an 86.34% increase from the breakout point.
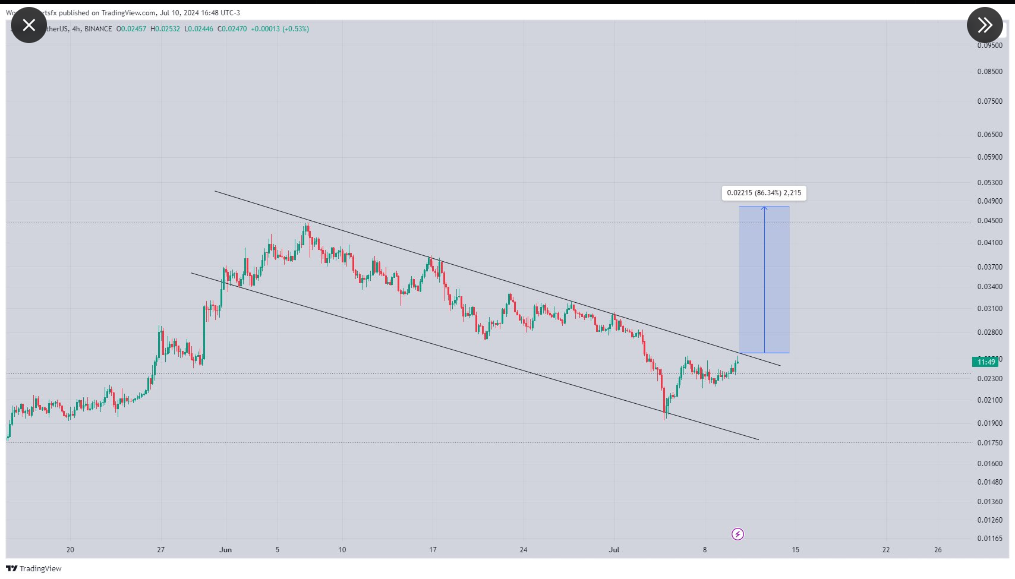
Source: World Of Charts
On the Bitfinex exchange, JASMY’s daily candlestick chart shows a recent downtrend, with the current price at $0.0234, a slight decline of 1.12%. Trading volume is relatively low at 25.433K. The price has been consolidating around the $0.023 level after a significant drop from the peak near $0.045 in early June.
The MACD (Moving Average Convergence Divergence) indicator is bearish, with the MACD line below the signal line and negative histogram bars, indicating continued downward momentum.
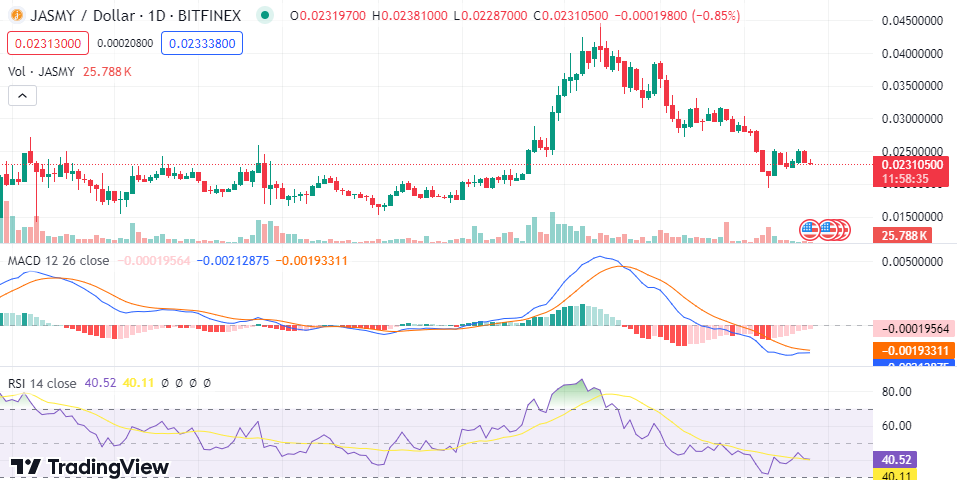
Source: TradingView
The RSI (Relative Strength Index) is at 40.40, suggesting the asset is in the lower range of the neutral zone but not yet oversold. The RSI has hovered around this level, indicating a lack of strong buying pressure.
The overall technical outlook suggests that JASMY is experiencing bearish sentiment with no immediate signs of a reversal. Traders might watch for potential support levels around $0.023 and resistance near $0.03 to determine future price action.
As of press time, the price of JasmyCoin (JASMY) stands at $0.02318 with a trading volume of $92,462,320 in the last day. This shows a decline of -6.40% in price over the past 24 hours, though the coin has experienced a 9.57% price increase over the past 7 days.