
Key Insights
- Solana’s price continues to trade within a bearish structure, with lower highs and lows confirming short-term selling dominance.
- Support at $78.50-$76.00 remains crucial, with failure to hold this zone likely to trigger further downside pressure toward $67.50.
- Multiple resistance layers between $86.80 and $101.40 limit any potential recovery, requiring strong follow-through buying to break through.
Solana (SOL) remains under significant downward pressure, with recent price action showing no signs of a meaningful recovery. On the 4-hour chart, SOL continues to trade within a well-established short-term downtrend. Despite brief attempts at recovery, the market’s bearish sentiment has kept sellers in control, with each rebound failing to shift momentum.
The current price behavior reveals a clear pattern of lower highs and lower lows, confirming that sellers dominate the market in the short term. SOL is trading below several key exponential moving averages (EMAs), including the 20, 50, 100, and 200 periods. These averages are aligned in a bearish manner, intensifying the downside pressure. Furthermore, the Supertrend indicator remains negative, suggesting a continuation of the current trend rather than a reversal.
Fibonacci Levels and Support Zones Under Scrutiny
The loss of crucial Fibonacci retracement levels has added to the bearish outlook for Solana. The break below the 0.382 and 0.236 retracements eliminated key recovery zones, making recent price rebounds appear corrective rather than sustained rallies. Immediate support is found between $78.50 and $76.00, an area where buyers are attempting to defend losses. A decisive drop below this range could push SOL toward the $67.50 mark, a key downside target.

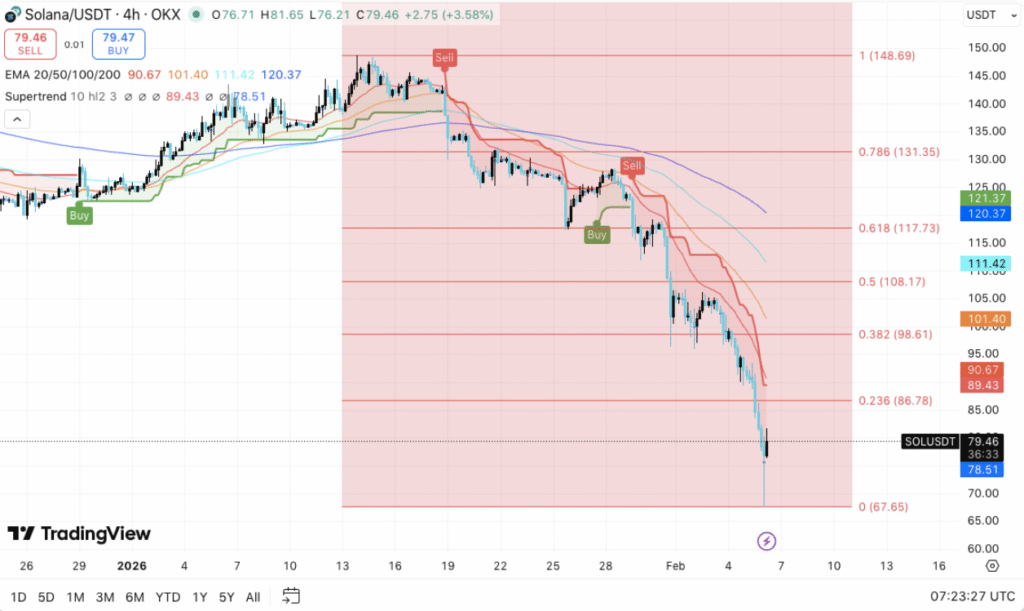
To the upside, SOL faces multiple layers of resistance, with the first notable barrier between $86.80 and $89.50. This zone is strengthened by short-term moving averages and a prior retracement level. Further resistance lies between $98.60 and $101.40, an area that marks a former breakdown point. These levels present significant obstacles for any recovery, as a lack of strong buying pressure could lead to renewed selling activity.
Leverage Trends and Derivative Data Provide Caution
Beyond the price charts, Solana’s derivative market data adds another layer of caution. Open interest reached highs above $15 billion during price rallies but has since dropped sharply, reflecting forced liquidations rather than new bearish positions.
This contraction in open interest, currently near $5.27 billion, suggests traders are unwinding positions rather than adding to short positions. Furthermore, spot flow data shows persistent net outflows, hinting at continued investor caution.