
- Argo Blockchain collapsed after losing a multi-month trading range, triggering aggressive downside price discovery.
- A widely shared technical assessment framed the decline as a structural breakdown rather than short-term volatility.
- A subsequent regulatory filing reinforced bearish expectations already reflected in price behavior.
Argo Blockchain underwent a severe repricing as technical damage intensified and regulatory disclosures followed. The stock’s rapid decline reflected a decisive shift in market structure, liquidity conditions, and participant behavior across a compressed time window.
Technical Breakdown Frames the Core Narrative
Argo Blockchain drew market attention after analyst Ali Charts described the move as an eighty-six percent decline within two weeks. The commentary emphasized that the selloff reflected capitulation and failed structural support. According to the assessment, the chart signaled a clear market regime shift. The observation framed the decline as persistent distribution rather than temporary panic.
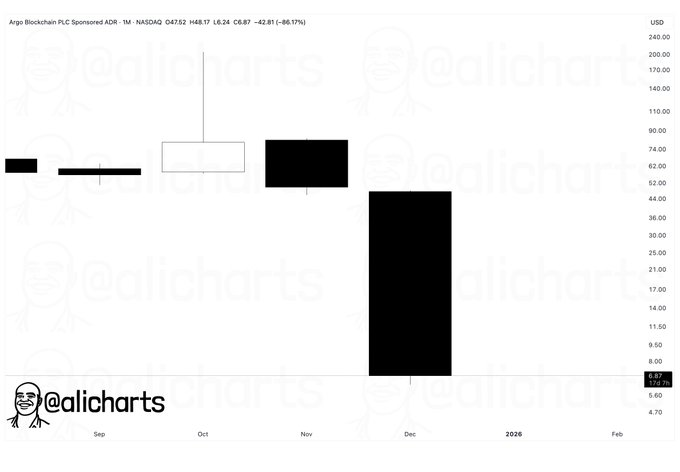
The analysis pointed to a massive bearish monthly candle dominating recent price action. That candle erased months of upside and closed near the lows. The lack of a meaningful lower wick suggested limited dip-buying interest. Sellers maintained control throughout the period.
Ali Charts further noted that price had previously consolidated between the mid-$30s and $60–$70 range. That zone functioned as value for several months. Once the lower boundary failed, a liquidity vacuum emerged. Price accelerated lower immediately after support broke.
Expansion After Compression Signals Trend Change
Argo Blockchain’s candlestick structure reinforced the primary technical argument. Prior candles showed overlap and visible wicks, indicating balance. The most recent candle displayed full bearish expansion. Such transitions often mark the beginning of new trends.
The vertical nature of the decline suggested forced selling dynamics. Moves of this magnitude rarely occur without liquidity stress. Margin-related selling and position liquidation likely contributed. Market positioning reset rapidly as price collapsed.
Ali Charts also identified the $6 to $8 area as a temporary pause rather than confirmed support. That zone lacks historical validation. Support typically forms through prolonged interaction. Without reclaiming higher levels, stabilization remains uncertain.
Regulatory Filing Confirms the Technical Signal
Argo Blockchain released a Form 6-K filing on December 12, which aligned with the technical warning. A separate market alert highlighted a 77% decline to approximately $6.87 following the disclosure. That reaction supported the earlier structural assessment. The filing removed remaining uncertainty for market participants.
The sharp response indicated that expectations were still misaligned before the release. Liquidity disappeared as risk was repriced instantly. The move resembled a gap-style adjustment rather than orderly selling. Balance sheet considerations dominated trading behavior.
Together, the two observations formed a consistent narrative. The technical breakdown identified risk before the disclosure. The regulatory filing validated that signal rather than reversing it. Argo Blockchain now trades under a different risk framework driven by recovery credibility.