
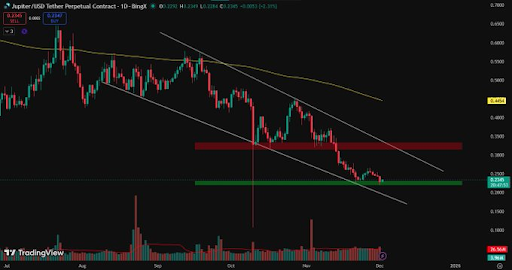
- JUP is forming a potential double-bottom on the 4H chart, with buyers stepping in at the demand zone for the second time.
- On the daily chart, JUP maintains $0.23–$0.24 support while staying below the MA200, reflecting ongoing trend dynamics and market pressure.
- Traders are watching breakout above $0.25 targeting $0.28–$0.32 or breakdown below $0.23 aiming for $0.21–$0.19.
JUP Price Analysis shows the token navigating a fragile structure as buyers and sellers react around a familiar demand zone. The market is weighing a developing recovery against broader bearish pressure visible on higher-timeframe levels.
Developing Structure on the 4H Chart
JUP Price Analysis first centers on the 4H chart, where Alpha Crypto Signal noted a potential double-bottom forming at the same demand region. This zone attracted buyers for the second time, creating an early show of strength after the recent bounce. Traders are watching how this reaction develops within the short-term structure.
The neckline of this pattern matches the placement of the 9 EMA and the 50 SMA on the 4H timeframe. This alignment creates a technical checkpoint where price acceptance or rejection may decide the next directional push. Momentum through this area is required to confirm progress beyond the developing setup.
According to Alpha Crypto Signal, a successful break above the neckline could confirm the double-bottom model. This would allow buyers to look toward higher areas if the structure holds. Until that happens, the pattern remains in formation, and traders are observing how price interacts with the mid-range zone.
Daily Chart Pressure and Wider Trend Context
JUP Price Analysis on the daily chart shows the token holding the $0.23–$0.24 support. Mayank Dudeja noted that this area sits near the lower boundary of the descending channel, creating an important reference point for upcoming sessions. The token has respected this zone while staying within a broader downward structure.
JUP is still positioned below the MA200 near $0.45. This keeps the overall trend on the bearish side, with every recovery attempt needing stronger follow-through. Until price reclaims this long-term marker, conditions remain tilted toward caution for directional traders.
Dudeja added that the next daily reaction near support may shape whether JUP creates a temporary lift or presses lower. Market participants are preparing for either a bounce attempt or continuation of the current decline.
Scenarios Traders Are Watching
JUP Price Analysis also includes two tactical approaches shared by Dudeja. A long setup carries a low probability unless the token breaks and closes above $0.25. If that happens, potential targets sit at $0.28 and $0.32, depending on sustained strength. Traders require confirmation before considering this scenario.
On the opposite side, a short setup carries higher probability if the token rejects and closes below $0.23. In that case, price targets extend toward $0.21 and $0.19. This setup aligns with the prevailing daily trend if downward pressure continues.
Market participants now await the next decisive move from JUP as both the 4H pattern and daily support zone converge into a pivotal moment for direction.