
- DOGE’s long-term chart mirrors prior cycles, forming a similar wedge-based Cycle 3 structure.
- Analysts note repeated fractal behavior that could guide long-term trend expectations.
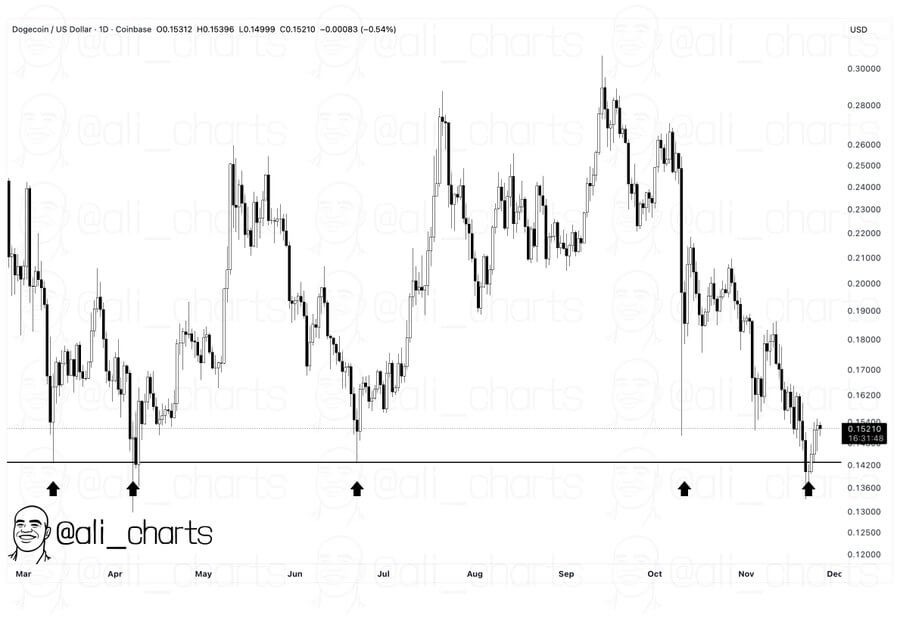
- The $0.14 support level remains resilient after five tests, reinforcing structural stability.
Dogecoin presents a repeating market pattern that matches its two earlier long-term cycles. The chart records wide consolidation phases followed by sharp upward moves, and the current structure reflects the same geometrical shape. DOGE may be forming the early stage of Cycle 3, which could support a move toward the multi-dollar region if the fractal repeats.
DOGE Cycle Structure Mirrors Earlier Patterns
Cycle 1 formed a broad base between 2014 and 2017, and the market later moved into a strong upward phase. Cycle 2 developed a similar consolidation from 2018 to early 2021, and the price reached a much higher peak. The same wedge pattern now appears inside Cycle 3, and the slope of the move follows the earlier rhythm with clean symmetry across the chart.
According to an observation by Bitcoinsensus, each cycle presents the same geometric structure before the rally. DOGE trades near the lower region of the Cycle 3 formation while holding a rising trend with steady higher lows. Analysts use the previous cycles to estimate potential long-term levels, and the study suggests that a repeated fractal could support a path toward the $5 area.
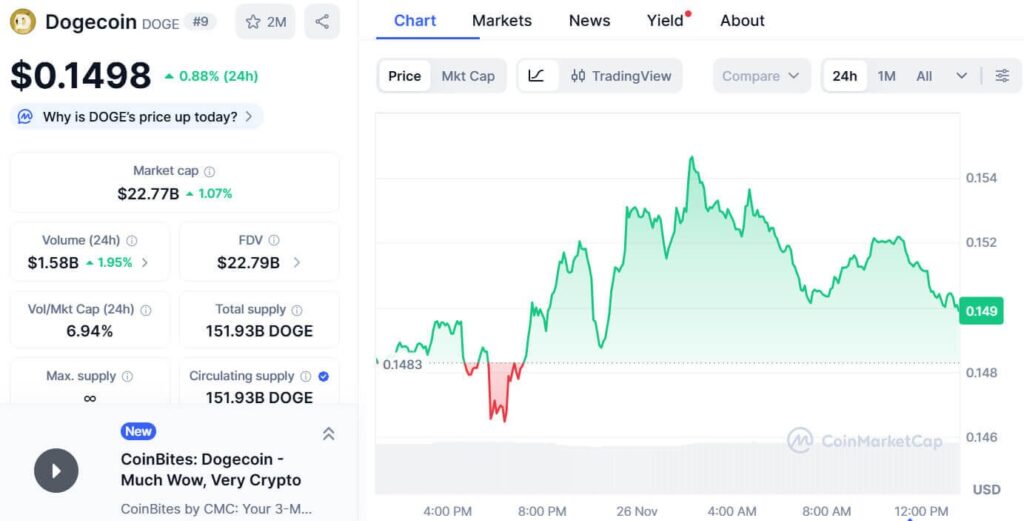
The upward channel that formed in 2023 remains intact, and the trend continues to show orderly movement. CoinMarketCap data records DOGE trading near $0.1498 with a market cap of $22.77 billion. The 24-hour volume stands at $1.58 billion, and the intraday chart shows steady swings between $0.149 and $0.153.
Support Zone at $0.14 Holds Firm Across Multiple Tests
Ali Charts reported that Dogecoin has tested the $0.14 support level five times this year. The chart shows touches in March, April, June, October and November, and each touch produced a clear reaction upward. The market kept stable movement along this horizontal floor as downward pressure formed lower highs from August through November.
Dogecoin trades near $0.152 in the latest candle, and the structure remains above established support. The chart records stable liquidity and controlled intraday movement as price holds steady inside the range.
Trading activity stays consistent, and the broader cyclical pattern remains active. The repeating fractal continues to guide long-term structure, and DOGE trades inside the same model that shaped earlier market expansions.