
- DOGE maintains long-term support at $0.05 and $0.14, forming a stable base for future moves.
- Trading data shows firm liquidity and steady volume as price holds within a narrow range.
- Monthly chart places DOGE below the Ichimoku cloud, signaling strong resistance overhead.
Dogecoin is forming a core support level just before the next surge, and current market data shows steady activity on long-term and short-term charts. The price records repeated reactions at two zones, and analysts report stable trading across all sessions. The market also keeps a clear structure that shows recurring demand and controlled swings.
Long-Term Support Zones and Trend Formation
Dogecoin continues to show stable support near $0.05 and later near $0.14, according to analysis prepared by Trader Tardigrade. The weekly chart records many rebounds from both points, and the pattern appears across several years of trading. The market also forms rising swing highs that create a long upward trendline from 2021 through 2025.
The same analysis shows a move toward the $0.70 region before the price falls back into the $0.14 zone. The projection then shows a push toward $1.20 while the long-term structure stays in place. Each move also forms a repeated cycle of expansion and retracement, and traders note steady demand at each return to support.
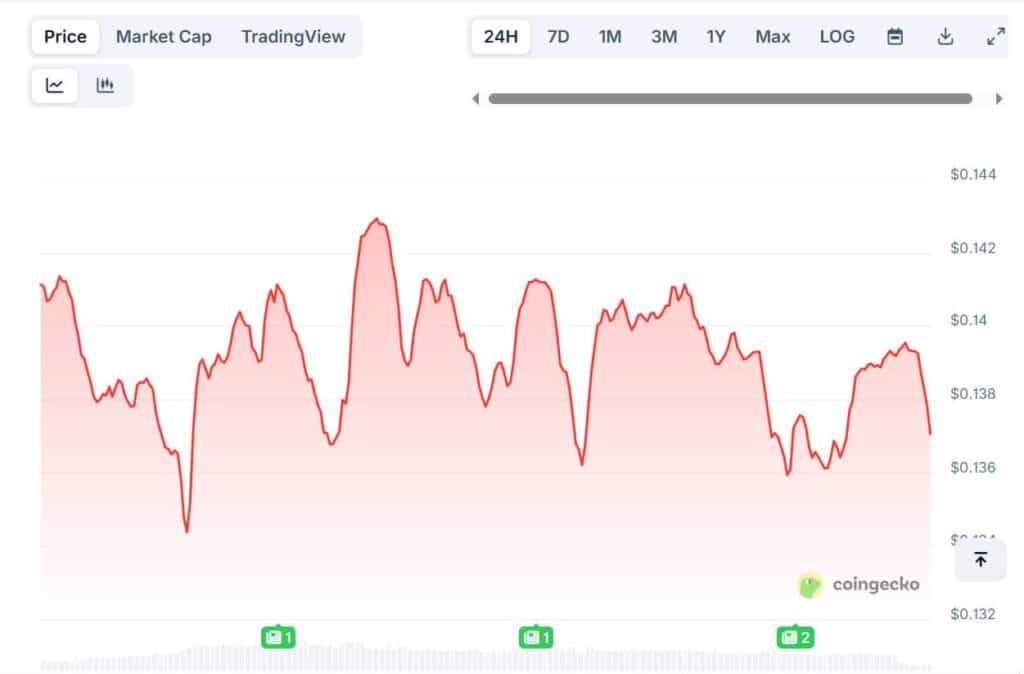
According to market data from Coingecko, Dogecoin trades near $0.137 after a 24-hour decline of 2.9 percent. The price ranges between $0.1344 and $0.1429 during the session, and the volume reaches $2.98 billion. The chart also shows several intraday pullbacks and rebounds that form a clear wave structure.
Market Activity and Ichimoku Cloud Observation
The data panel records stable liquidity, and the market trades inside a narrow range with repeated tests of both boundaries. The chart shows many short moves between peaks, and the trading volume remains firm across the session.
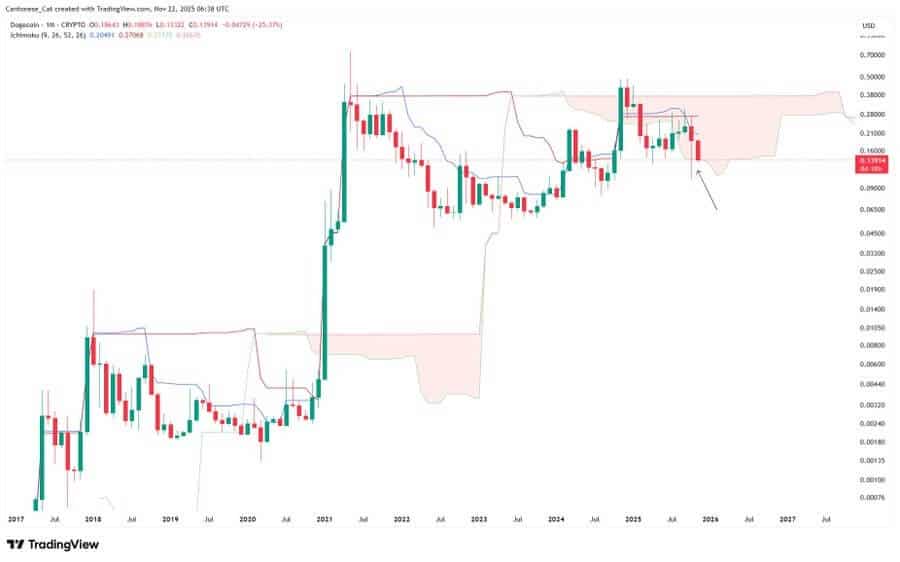
Furthermore, the structure also shows price movement above the lower band while traders respond to each move toward the upper band. According to an observation by Cantonese Cat, the monthly chart shows Dogecoin trading below the Ichimoku cloud while testing the lower line.
The cloud forms a large resistance area, and the Tenkan-sen and Kijun-sen lines move close together during this phase. The chart also shows earlier peaks near $0.70 and lower highs, and the latest candle moves near the marked zone as price pressure forms below the cloud.