
- SOL holds the $135–$140 demand zone as buyers defend repeated tests and slow the downtrend.
- Price action shows steady ranges and rebounds while traders monitor resistance near the $150 level.
- Liquidity remains strong with active volume as SOL forms clear structure across major support zones.
Solana moved through tight ranges for many weeks and created clear consolidation zones across the chart. The market then dipped into the $135–$140 demand area and formed early signs of a possible reversal while buyers defended repeated tests of this zone.
Consolidation Zones Shape Recent Market Structure
SOL traded between $137.97 and $143.26 during the latest session, and price action showed frequent swings as traders reacted to broader moves in the market. Buyers pushed the price toward $144 early in the period, yet sellers brought pressure later and created a steady move lower. The market then formed short rebounds that kept momentum active through the middle of the session.
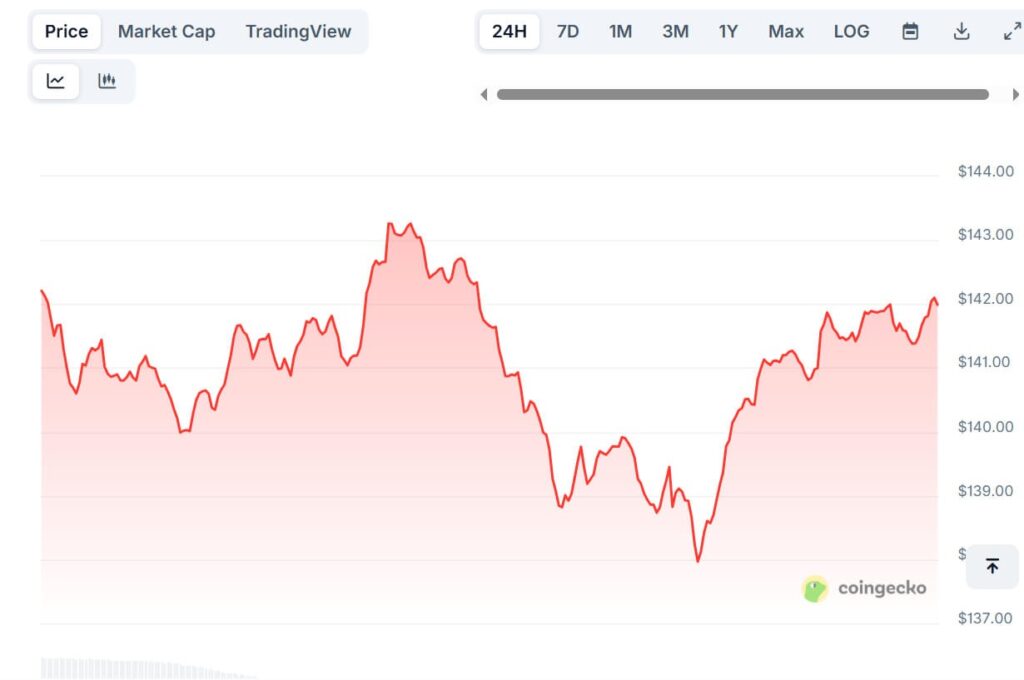
Data from Coingecko showed a market cap of $78.68 billion and trading volume of $3.39 billion for the same period. Circulating supply reached 554.18 million SOL, and total supply reached 614.10 million SOL. The chart showed firm liquidity because traders created fast movements during most hours of the session.
The structure also showed the first key range below $210, as price moved sideways around the mid-$190 area before breaking down toward $160. A second range formed around the $165–$175 band, and sellers kept control as the downtrend continued. The chart then recorded lower highs and lower lows as the market moved toward the $140 zone. SOL reached the $135–$140 demand area again, where earlier reactions had taken place across past sessions.
Buyers Defend Demand Area Near $135–$140
Short-term action showed buyers holding the lower zone while sellers lost momentum near the recent low, according to an observation by CryptoCurb. Price created a small rebound as it moved toward $143, and traders now watch whether SOL can keep movement above near-term resistance.
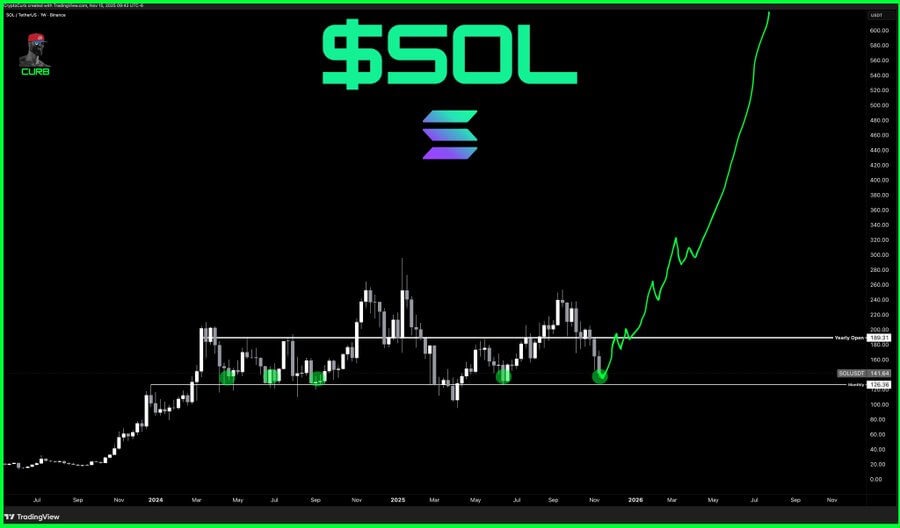
The yearly open sits near $150, and the market now trades slightly below this level. The chart shows repeated supports near the same horizontal zone, and several past rallies moved toward $200–$260 before retracing. Traders now watch if a move above $150 can form a stronger recovery, as the recent demand area continues to attract buyers across repeated tests.