- Hyperliquid resists market drops, falling just 5% while Bitcoin, Ethereum, Solana, and Chainlink decline sharply.
- Technical charts show $HYPE in a corrective ABC pattern, with key support at $27–$30 and resistance at $48.50.
- Breaking below $36 may trigger one more low, while surpassing $41.59 could lead to a more complex correction.
Hyperliquid ($HYPE) faces a critical moment as major whales offload positions, yet the token shows remarkable resilience compared to other cryptocurrencies. According to analyst DC on X, whales holding hundreds of millions in $HYPE have sold over the last three months.
Additionally, looming unlocks are fueling widespread FUD on social platforms. However, Hyperliquid’s price has only dropped 5%, significantly outperforming blue-chip cryptocurrencies that have seen declines of around 20% or more. This unique stability makes $HYPE one of the most notable performers in a broadly declining market.DC’s analysis tracks five major cryptocurrencies over three months. Bitcoin fell 17.2%, Ethereum 21.2%, Solana 20.1%, and Chainlink recorded the sharpest decline at 30%. All these assets hit new lows by mid-November.
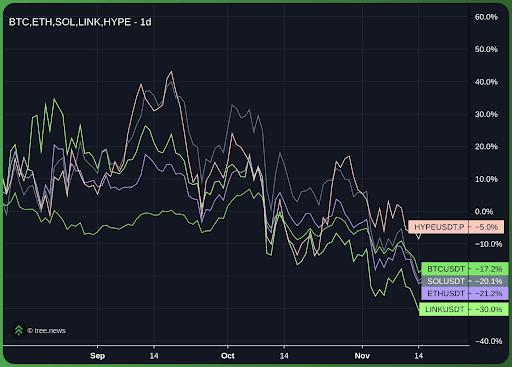
Conversely, Hyperliquid maintained stability near its baseline, diverging sharply from the downward trends of other coins. September marked peaks for most assets, with October triggering synchronized declines and November intensifying downward pressure.
Technical Patterns Show Corrective Phase for Hyperliquid
Analyst More Crypto Online on X offers additional technical insight using Elliott Wave theory. Hyperliquid currently trades at $38.626 against Tether on KuCoin. The token completed a five-wave impulse sequence from early October to mid-November, starting with a decline to $38.00, followed by a recovery to $50.00, then subsequent lows near $28.00.
A corrective ABC pattern then developed, with Wave A hitting $44.00 and Wave B retracing to $34.50. The development of Wave C suggests that consolidation is still ongoing. Resistance at $48.50 and support at $27.00 and $30.00 are important technical levels. Potential targets for traders include the Fibonacci retracement levels at 38.2%, 50%, and 61.8%.
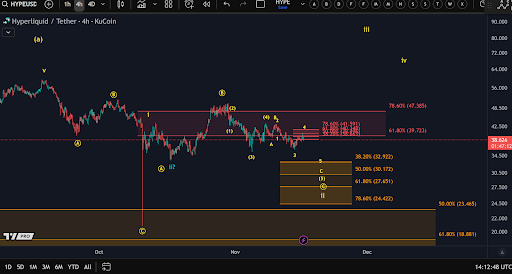
Moreover, a break below $36 could confirm the start of Wave 5, suggesting one more low may occur. Conversely, surpassing $41.59 might open the door for a more complex correction, showing the market has not yet formed a meaningful low.