
- Bitcoin trades in an ascending triangle, holding higher lows near $107,500 and resistance at $115,000.
- Analysts identify $112K as the key breakout level that could trigger Bitcoin’s next all-time high.
- BTC shows stable momentum with steady volume and strong liquidity above the $110K price range.
Bitcoin (BTC) continues to trade within a tightening ascending triangle pattern, maintaining higher lows near $107,500 and resistance around $115,000. The structure indicates that there is a possibility of retesting the support of the $107,500 before another increase to the $115,000 resistance level. Market conditions are stable with average volatility and high liquidity among exchanges.
BTC Maintains Ascending Structure and Stable Market Performance
The four-hour Bitcoin chart shows price movement between $107,000 and $115,000, forming an ascending triangle pattern. According to analysis by Ali Charts, BTC recently rebounded from $108,000 and moved toward $110,000, showing consistent higher lows. The resistance around $115,000 is still taking a horizontal upper limit that is indicative of controlled prices.
Bitcoin traded at $110,315.70, recording a 0.48% daily increase with a market capitalization of $2.2 trillion. Its fully diluted valuation stood at $2.31 trillion, while 24-hour trading volume reached $32.53 billion, representing a 19.99% decline from the previous session. The balanced market activity was indicated in the price range between $109,940 and $111,000.
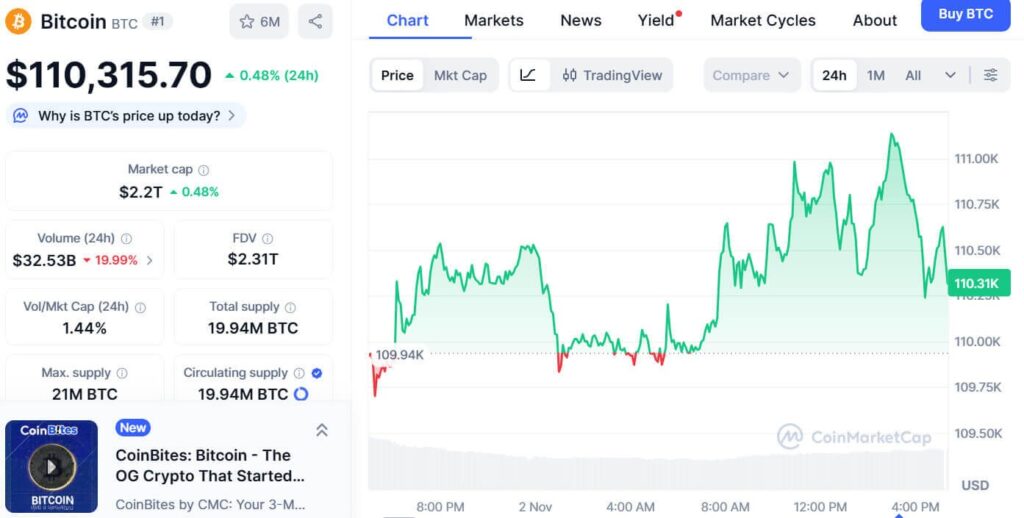
The volume-to-market cap ratio was 1.44% showing stable liquidity in all the trading platforms. BTC remained above the level of $110,000 as traders remained consistent. CoinMarketCap data showed that short-term changes were kept under control and the general trend was also positive.
Analysts See $112K Breakout as Key for New Highs
According to analysis by Michael van de Poppe, Bitcoin needs to break above $112,000 to enter strong territory for a potential new all-time high in November. BTC has been trading around the range of $111,918 having recovered, after the support zone of $107,200.
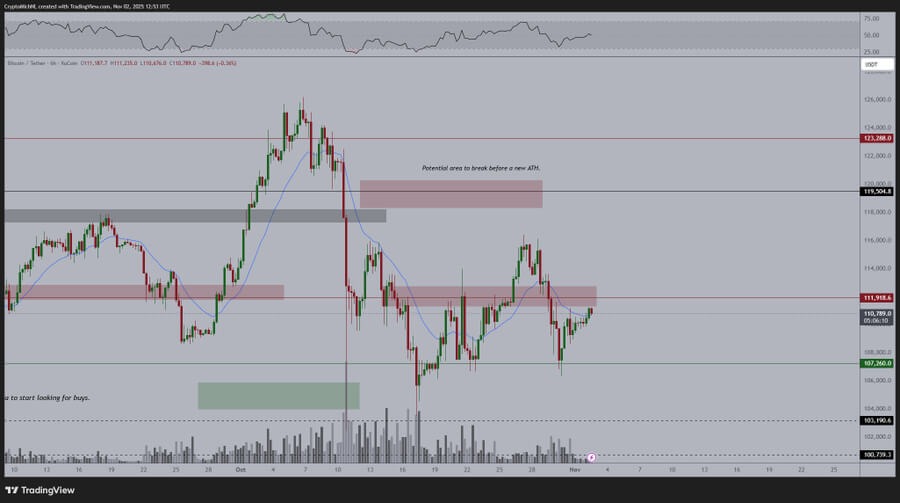
In the chart, resistance is around $113,800 creating a short-term supply zone, and there is a larger resistance between $119,900 and $123,900. The RSI reading remains neutral, showing balanced momentum.
Buyers continue to defend the lower range effectively, maintaining the ascending structure above $107,000. The trading volume is stable and analysts believe that Bitcoin will consolidate before falling back to the test of the $115,000 mark. Should the buyers continue to maintain the movement above the present channel, the next upward move may be directed towards the $120,000 range.