
- DOT eyes a bullish breakout, requiring a successful retest to confirm the move, with critical support at $4.850.
- Strong medium-term support for DOT exists between $4.0 and $3.7, crucial if market sentiment turns bearish.
- DOT’s technical setup shows potential for upward movement, targeting a higher resistance level around $7.40.
Polkadot (DOT) has been one of the standout performers in the crypto market. Despite recent market corrections, DOT has shown remarkable resilience, navigating a falling wedge pattern. The asset is currently aiming to retest the upper resistance of this pattern.
Eyeing a Bullish Breakout
A bullish breakout for DOT is promising, but it requires a successful retest to reinforce and confirm this breakout. Should the price fall back into the wedge, it’s likely to retest its support at $4.850. This level will be crucial for assessing DOT’s strength, and failure to hold here could indicate a potential decline.
If the broader market sentiment turns bearish with selling pressure, DOT might revisit its strong medium-term support between $4.0 and $3.7. This zone has historically provided substantial support and will be critical for DOT’s future movements.
Impact of Market Sentiment
The overall market sentiment and Bitcoin’s price movements will significantly influence DOT’s price action. Traders and investors should keep a close eye on these factors, as they could dictate DOT’s next move.
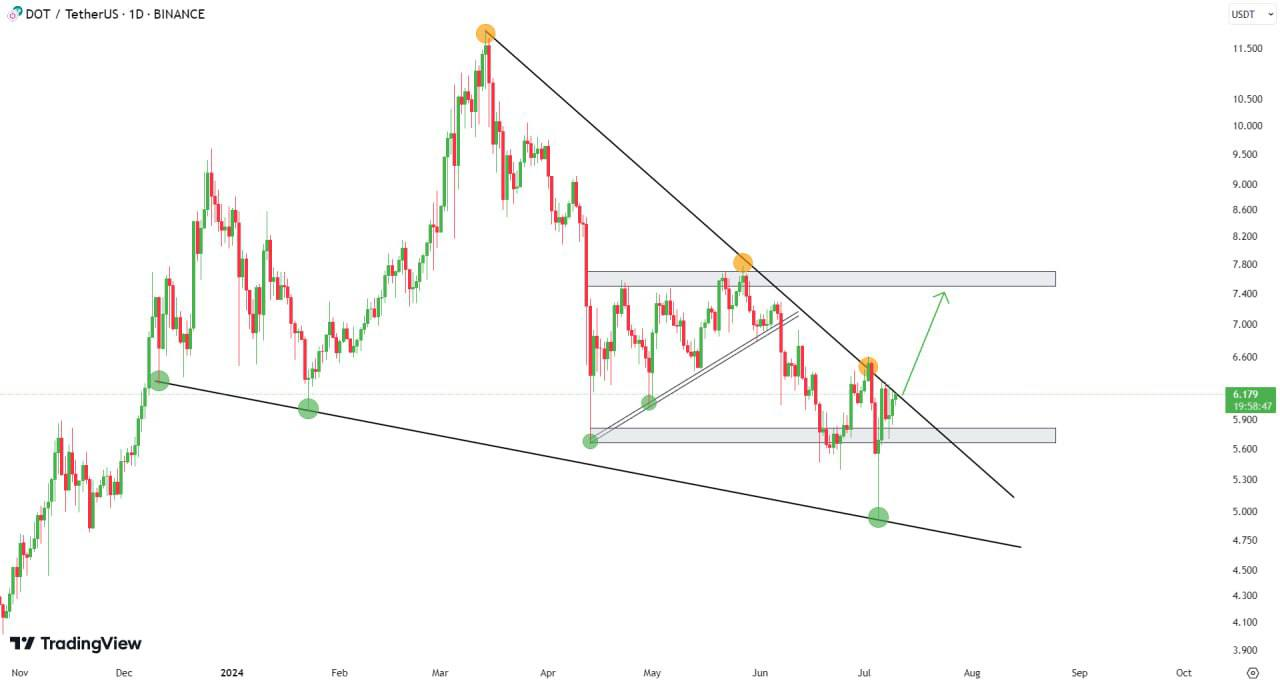
The technical analysis highlights a period from November to October, with the current price around $6.17. Significant volatility is noted, with a major peak in March followed by a downtrend. A long-term descending resistance line from the March peak and a shorter-term ascending support line from the April low are identified. Key resistance levels are marked around $7.40 and $5.90. Recently, DOT has broken above the long-term resistance line, indicating a bullish signal for potential upward movement. There is a possibility of targeting the higher resistance level around $7.40.
Short-Term Movements
In a recent 8-hour period, DOT started around $6.100, reaching a peak of about $6.250 before gradually declining with fluctuations. The price ended at $6.132, showing slight overall growth. The resistance is noted around $6.250, and support near $6.100.
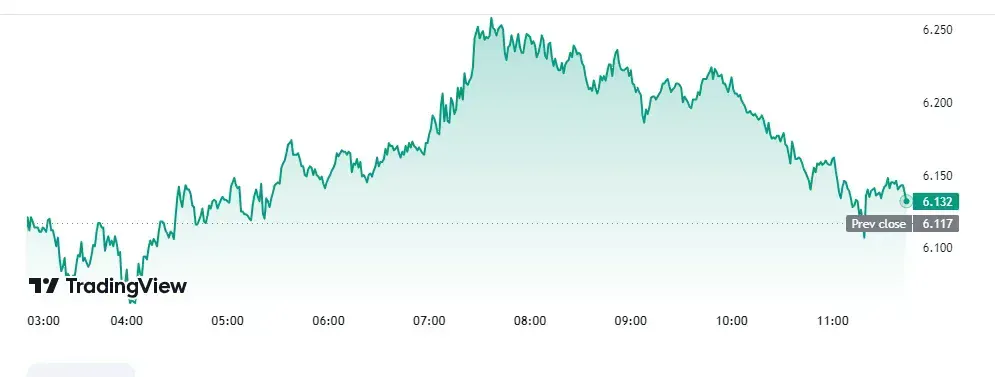
Source: TradingView
DOT’s current technical setup suggests it is at a critical point, having broken above a long-term resistance line. Traders are watching for confirmation of this breakout and potential movement towards higher resistance levels. As always, market sentiment and external factors will play a significant role in determining DOT’s future price action.