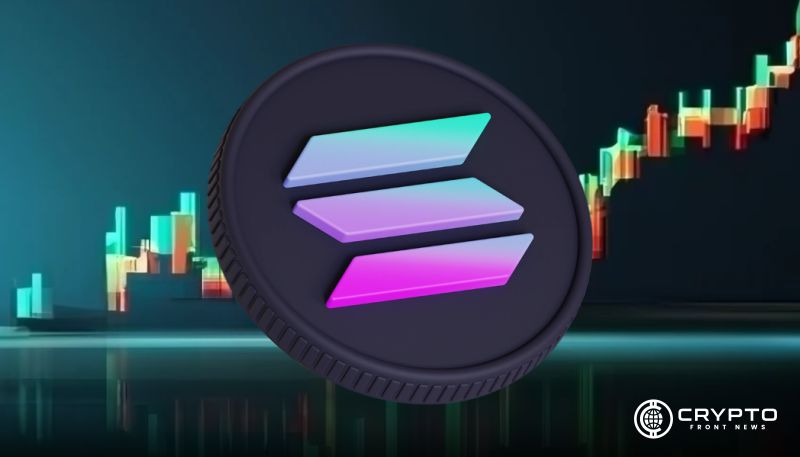
- Solana (SOL) maintains stability above the crucial $190 support, within the bullish ascending channel .
- Hidden bullish divergence on the 4-hour chart and a double-bottom formation strengthen prospects .
- Solana ETFs attract early inflows exceeding $130 million, reinforcing its position alongside Bitcoin and Ethereum.
Solana (SOL) is holding the $190 mark support,traders are anticipating a strong rebound toward $240 and possibly $300. Bullish momentum and rising ETF interest are fuel for renewed market excitement.
Solana Holds Channel Support as Bulls Eye $240 Recovery
Analysis by market analyst Ali Charts shows that Solana must maintain the $190 support area to sustain its upward trajectory. A bounce from this zone could confirm the next stage of recovery toward $240 and potentially $300 if momentum strengthens.
SOL 7-day drop stands at 3.10%, but despite this short-term weakness, traders interpret the pattern as a consolidation phase inside a broader bullish structure.
If Solana continues to respect its lower trendline, there is a probability of retesting the $200 resistance area. If the asset manages to breakout above $200 it could make a move toward the $290 level by December, as projected in technical outlines shared by Ali.
Hidden Bullish Divergence Signals Possible Price Reversal
Veteran trader Matthew Dixon noted that Solana’s 4-hour chart is showing a hidden bullish divergence — a technical setup often seen before a trend reversal. The analysis points to a key support level at $180, where buyers have repeatedly stepped in to absorb selling pressure and defend the zone.
Dixon also observed that Solana’s Relative Strength Index (RSI) remains near 41, suggesting that selling momentum is fading. The formation of a “double bottom” near $180 further supports the idea of a rebound, as this structure frequently signals renewed buying interest.
If SOL breaks above the $190–$200 resistance range, technical confirmation could follow, setting the stage for a stronger recovery phase. The outlined movement indicates that a short-term rally toward the upper resistance near $200 remains likely if buying momentum persists.
Liquidity and Institutional Growth Strengthen Solana’s Market Base
A Solana heatmap visualization reveals strong liquidity accumulation between $178 and $182, confirming that buyers are building positions around current levels. The liquidity clusters near $200–$205, marked by dense sell orders, indicate an important short-term resistance zone. For now, the market appears to be consolidating, with a gradual shift toward bullish bias as volume builds near support.
Beyond technicals,new ETF products like Bitwise’s $BSOL, which launched with $130 million in trading volume, and Grayscale’s $GSOL—adding another $4 million—demonstrate Solana’s growing mainstream acceptance. With improving network stability and rising institutional exposure, Solana’s ecosystem continues to attract both retail and professional investors.