
- Bitcoin holds below $117K resistance, keeping bearish momentum active near key price levels.
- Sellers defend the $116K zone; a drop toward $105K, $93K, or $76K may follow if rejection persists.
- A breakout above $117K could shift sentiment bullish and spark a rally toward $150K or higher.
Bitcoin continues to trade below the $116,000–$117,000 resistance zone after completing a bearish retest earlier this week. The price remains under pressure as sellers defend the key resistance area. Market activity suggests that further rejection can lead to a corrective action towards $105,000, $93,000, and $76,000.
BTC Faces Resistance Near $116K–$117K as Sellers Maintain Control
According to analysis prepared by Crypto Patel, Bitcoin has maintained a bearish structure below the $116,000–$117,000 resistance zone. The asset rose above the rising trendline in May to October and then broke beneath the same in late October. Following the breakdown, price again tested the previous trendline at around $114,000 and could not bounce back.
Current data from Coingecko shows Bitcoin trading around $110,900, marking a 0.7% increase over the past week. The price fluctuated between $108,201 and $113,567, showing moderate volatility. Market capitalization stands at approximately $2.21 trillion, supported by a circulating supply of 19,941,900 BTC.
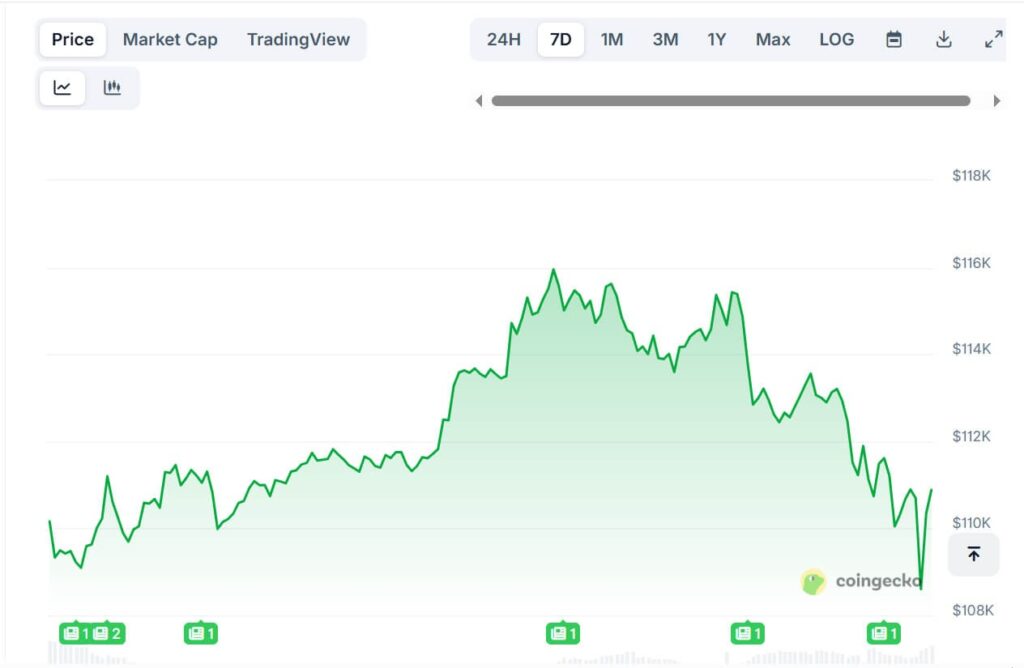
The 24-hour trading volume is around $71 billion, reflecting active market participation. In case the rejection continues to the level of $116,000 resistance, a correction can go down to a level of $105,000 in the Fibonacci retracement 0.382 zone. More losses would reveal the level of the bearish momentum of the $93,000 and $76,000.
Diamond Pattern and Market Structure Indicate Potential Breakout Scenarios
According to an observation by CryptoTA_King, Bitcoin has formed a diamond pattern on the daily chart between September and October. The structure shows converging trendlines with price compression between highs of $118,000 and lows near $104,000.
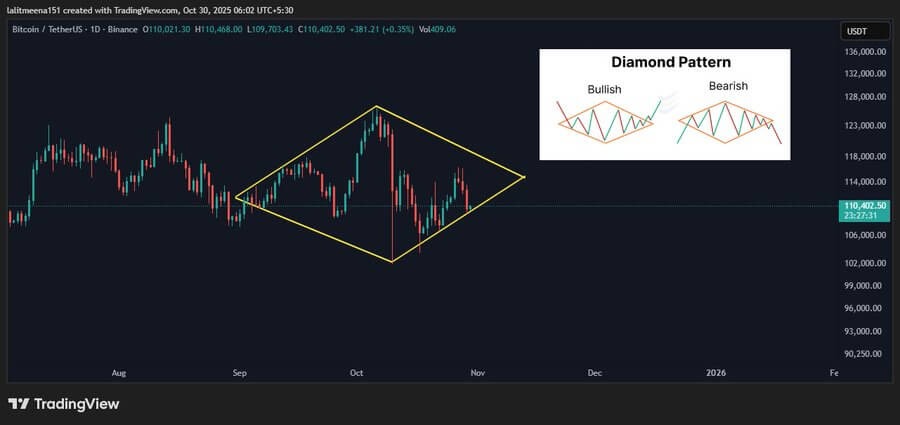
The pattern suggests equilibrium between buyers and sellers as Bitcoin trades close to $110,400. The chart outlines both bullish and bearish breakout scenarios depending on confirmation levels.
Breakout and close above $117,000 would change the tone to bullish and open a long-term rally towards $150,000 or beyond. Traders are so far keeping a bearish bias below the $116 000 resistance area and watch the critical Fibonacci support zones with possible reactions.