
- Bitcoin confirms a falling wedge breakout on the 4H chart, targeting a 10% rally toward $115K.
- BTC stabilizes near $108K with strong volume growth, reflecting active market participation and liquidity.
- Analysts identify $107K as key support before potential continuation toward higher resistance levels.
Bitcoin is trading within a technical structure that reflects a falling wedge breakout followed by a retest on the 4-hour timeframe chart. Market observations show BTC stabilizing above key support levels while maintaining a positive technical formation. Price action remains to be consolidating around $108,000 with the market showing controlled movement and consistent trading volume across major exchanges.

BTC Displays Falling Wedge Breakout and Retest Pattern
Bitcoin recently broke above a descending wedge pattern formed since early October, according to analysis prepared by Captain Faibik. The movement was preceded by consecutive lower highs and lower lows followed by an upward breakout to $111,000. The price then retested the upper boundary of the wedge near $108,000, confirming a potential continuation zone.
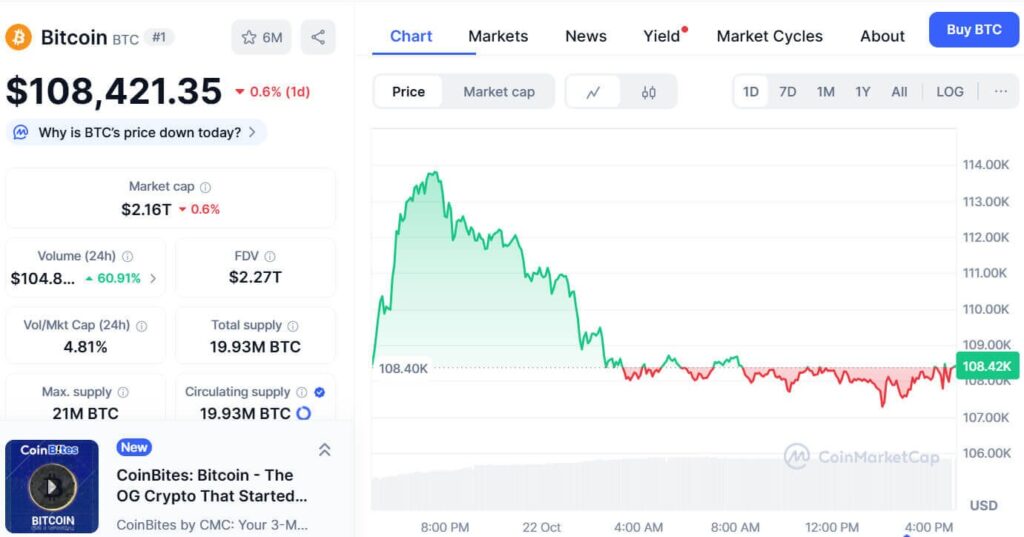
CoinMarketCap market data indicates that Bitcoin is trading at $108,421.35, which represents a daily decrease of 0.6%. The market capitalization stands at $2.16 trillion with a 24-hour trading volume of $104.8 billion, marking a 60.91% increase. The 4 hour structure reflects an estimated upside of about 10% where targets range between $114, 500 to $115,000.
Resistance remains near $115,000, while the $107,000 level acts as a short-term support zone. This trend is in line with normal wedge breakouts, where the price narrows down ahead of a possible bullish run. Bitcoin’s stable structure and consistent liquidity reflect active market participation. Volume growth supports the ongoing accumulation phase observed near current price levels.
Analysts Monitor Key Support and Resistance Levels
According to an observation by Daan Crypto Trades, Bitcoin failed a breakout above the high-volume node and returned to the $107,000 support area. This level remains crucial before any retest of Friday’s lows, where previous wicks formed. “The CME gap was closed, and we saw a decent bounce in the short term,” the analyst noted.
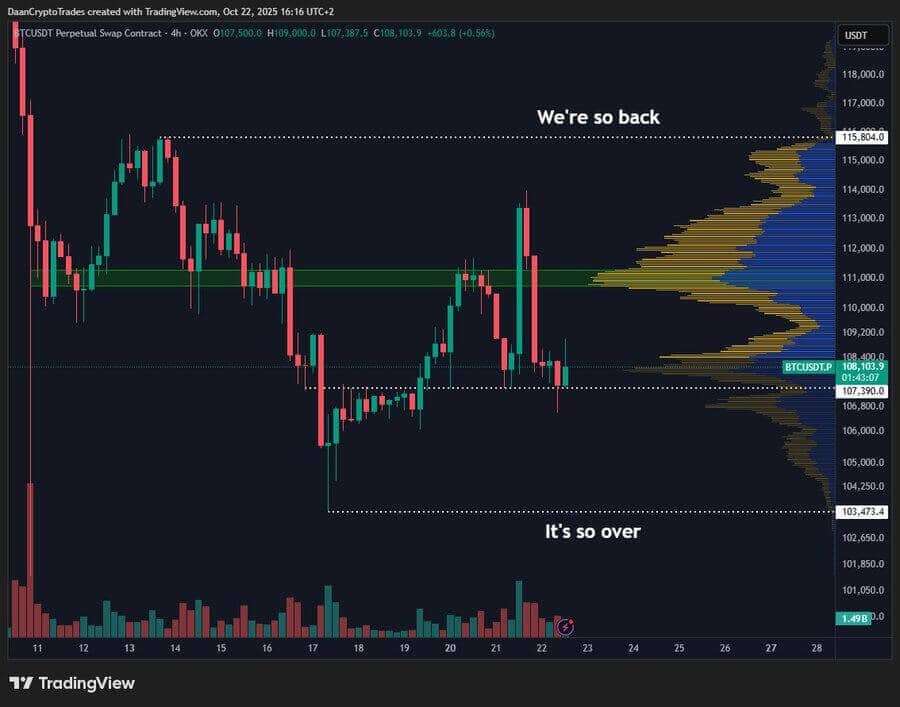
The 4-hour chart in the period between October 11 and October 22 reveals that Bitcoin dropped from above $115,000 but then stabilized around $104,000. This was then followed by a rebound that saw prices going to new heights of about $112,000 before it was halted by resistance.
Current consolidation between $107,000 and $111,000 displays strong liquidity and balanced market movement. Generally, BTC represents a favorable technical position with a forecasted 10 percent positive price increase in case the momentum continues to stay above the breakout zone.