
- Bitcoin nears record highs with sharp swings as traders prepare for Q4 momentum while remaining cautious of sudden pullbacks.
- BTC price action highlights strong resistance near $124,200 as sellers push retracements, keeping consolidation in focus for traders.
- Daan Crypto Trades notes October strength yet warns traders to avoid heavy leverage during potential flushes and sharp corrections.
Bitcoin showed sharp volatility heading into the weekend, sparking excitement and caution among traders. The cryptocurrency almost touched its all-time highs late Friday before closing slightly lower. According to analyst Daan Crypto Trades, Bitcoin only needs a small push to break records. However, he warned the weekend may lack the strength to sustain such a breakout, suggesting instead a period of consolidation.
The price opened near $121,360 during Friday’s session and quickly surged toward $124,200. This marked a powerful rally but soon met resistance. A discernible correction was brought about by the strong entry of sellers, which created downward pressure. Bitcoin erased much of the previous gains as it fell back below $121,630. The retracement demonstrated how easily momentum may change, particularly in the vicinity of significant resistance levels.
Key Technical Signals
The chart displayed on X by Daan Crypto Trades highlighted several critical market markers. The CME Close appeared on the left, signaling the prior futures session’s settlement. Meanwhile, the CME Open stood on the right, underlining the gap between close and fresh trading. Traders often watch these gaps closely since they can attract price movement in later sessions.

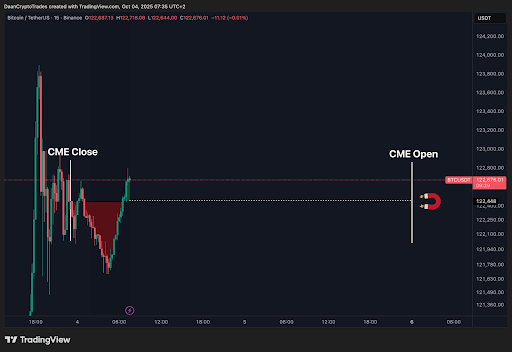
Moreover, the chart included a horizontal dotted line at $122,448. This level acted as a guidepost for the trading range. A shaded red zone between the CME Close and session lows visually illustrated the correction. As of the latest reading, Bitcoin traded at $122,676.01, reflecting a tiny decline of $11.12 or 0.01%.
Market Behavior and Trader Sentiment
The 15-minute chart captured Bitcoin’s rapid swings, with green candlesticks highlighting buyer dominance and red bars showing selling pressure. Volume activity intensified during the correction phase, pointing to heavier selling. The magnet icon on the chart suggested areas of strong liquidity where price could gravitate.
Daan Crypto Trades emphasized balance despite the bullish momentum. “October & Q4 starting off with a bang,” he noted, while urging traders not to overleverage during inevitable flushes. Consequently, many traders remain cautious, aware that quick shifts can punish those pre-positioning for breakouts.