
- Bitcoin consolidates above $109K while the 50 EMA and Fibonacci levels at $99K, $79K, and $49K highlight critical support confluence.
- Titan of Crypto notes that the 50 EMA and Fibonacci retracements align as strong support, reinforcing Bitcoin’s long-term bullish structure.
- Despite short-term pullbacks, Bitcoin’s rising 50 EMA and Fibonacci levels suggest resilient momentum with bulls defending key price zones.
Bitcoin’s rally faces a crucial test as traders monitor a potential pullback toward confluence zones highlighted by Titan of Crypto on X. He noted that the next strong support could emerge around the 50-period exponential moving average (EMA), aligning with the 50% Fibonacci retracement level. This is the same setup where Bitcoin found footing during past market dips.

Binance’s weekly Bitcoin-to-Tether chart has a distinct pattern from late 2022 to forecasts for 2027. Following the 50 EMA’s steady ascent, price action jumped from $15,000 in early 2023 to high around $135,000. The EMA served as dynamic support during this bull run when the price broke through resistance levels.
Critical Fibonacci Zones
Moreover, the chart identifies three Fibonacci retracement levels that could guide potential pullbacks. The first sits at $49,292, offering long-term support from earlier price swings. The second is near $79,214, considered a mid-range pullback zone. The third rests at $99,560, which overlaps with current trading activity around $109,000.
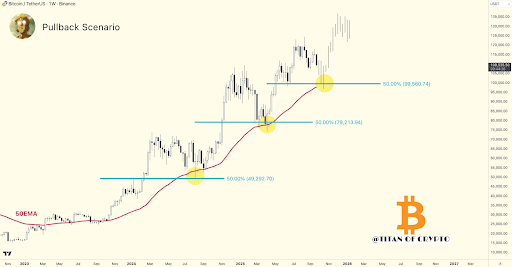
Besides, yellow circles highlight these retracement points, marking areas where traders may expect demand to return. Hence, these levels serve as psychological checkpoints in case of deeper corrections. Additionally, they represent mathematical relationships to the major upward swing that powered Bitcoin’s rise.
Consolidation After Parabolic Gains
A sharp rally in late 2024 lifted Bitcoin from $60,000 to over $100,000 in weeks. Consequently, the market entered consolidation above $109,000 as participants digested gains. Volume bars indicate strong participation, but current candlestick formations suggest indecision near resistance levels.
However, Bitcoin continues to trade above the 50 EMA, which rises each week. This reinforces the bullish momentum and provides technical support against deeper drops. Moreover, the EMA remains a widely followed indicator that reflects intermediate trend direction.
“The next major support confluence would be around the 50 EMA if the correction extends further,” Titan of Crypto stated. His research demonstrates how, in spite of transient volatility, Bitcoin’s long-term structure holds firm.
While support zones line up with established technical levels, Bitcoin consolidates close to highs. The long-term upward trend remains stable if bulls protect the 50 EMA.