
- Bitcoin price has historically recovered after breaking through average purchase price levels.
- Previous cycles show Bitcoin hitting bull peaks two years after bear market lows.
- Bitcoin price patterns suggest potential long-term bullish trends, according to CryptoChan data.
Bitcoin (BTC) continues demonstrating historical price patterns, revealing cyclical trends from past bear market bottoms to bull market peaks. A new analysis highlights key moments from 2015, 2019, and 2023, focusing on Bitcoin’s behavior following periods of significant price drops.
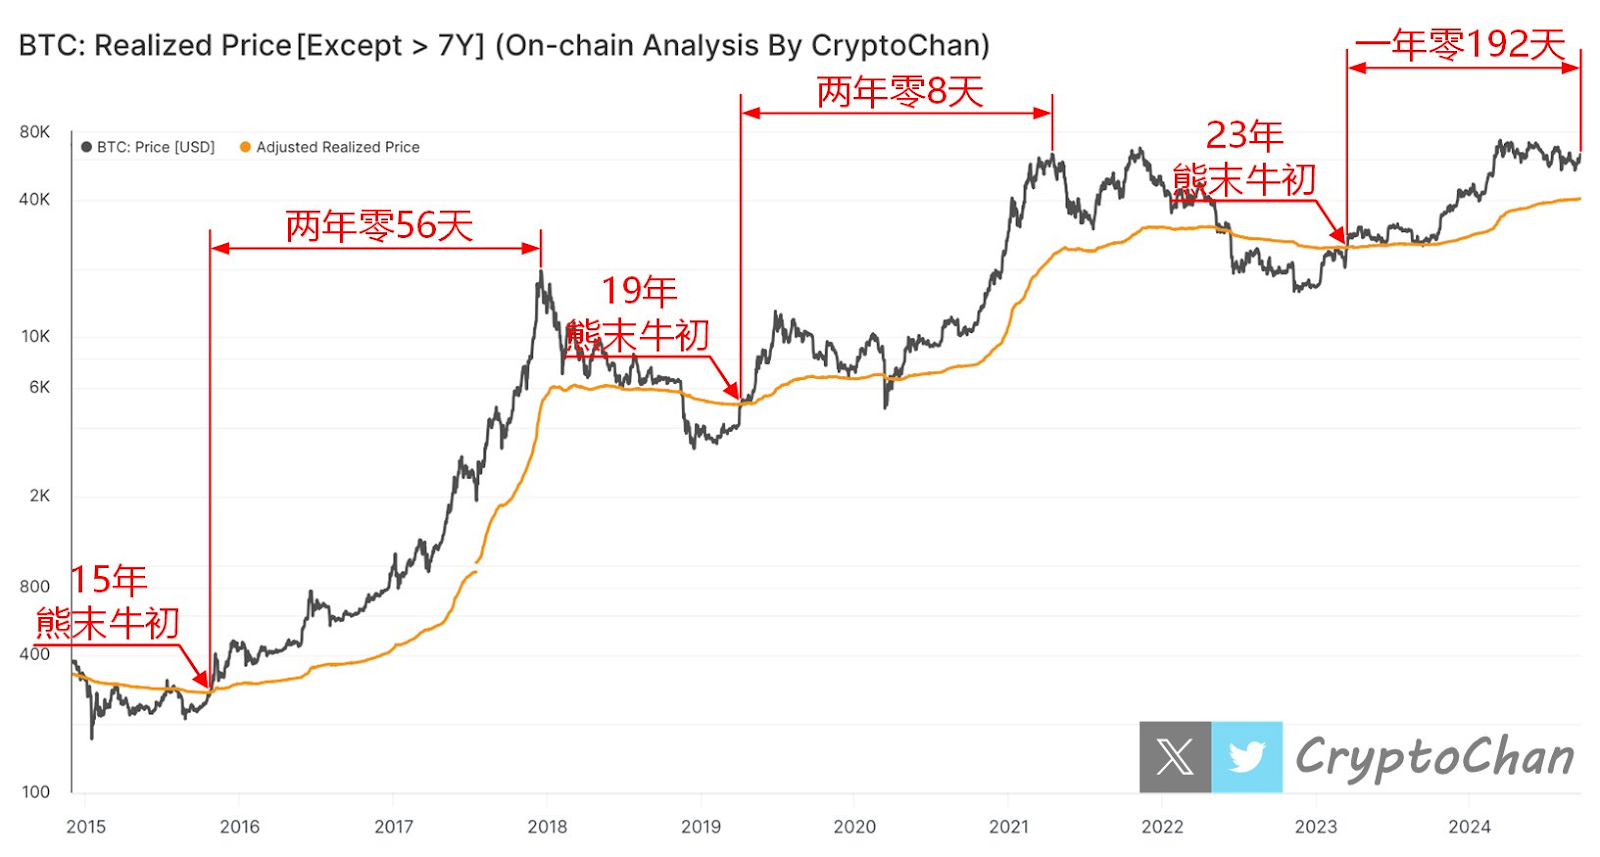
The analysis shows that in 2015, after a prolonged bear market, Bitcoin’s price broke through the average purchase price on the blockchain. This price level, often referred to as the realized price, represents the average cost paid for circulating Bitcoin tokens.
Following this breakthrough, Bitcoin continued to rise, reaching its bull market peak two years and 56 days later. A similar pattern emerged in 2019, with the price reaching a new peak two years and eight days after breaking through the realized price level.
In 2023, Bitcoin once again crossed the average purchase price, signaling the beginning of a potential new cycle. It has been one year and 192 days since this event, suggesting the possibility of continued growth in the near future.
Historically, Bitcoin’s price tends to surge after breaking through this key threshold, marking the start of a bull market.
The chart, created by CryptoChan, shows the price trends with the black line representing the Bitcoin price and the orange line representing the average purchase price.
The chart emphasizes the importance of this threshold as a support level, especially during market downturns. It also highlights how Bitcoin’s price recovery follows similar patterns after touching or crossing the adjusted realized price.
Source: CryptoChan
Bitcoin tokens that have remained unmoved for over seven years are excluded from this calculation, as they are considered either lost or in long-term dormancy. This adjustment helps refine the accuracy of the data, making it a valuable tool for understanding Bitcoin’s potential future movements.
The repeating price patterns in different market cycles provide clues about Bitcoin’s long-term trends. Investors and analysts will likely focus on these past trends as the market changes. Bitcoin’s price moves in the next few months will help show if it follows previous cycles.