
- Dogecoin has shown multiple breakouts after consolidation phases, with historical rallies following falling wedge patterns.
- Support at $0.05–$0.06 and a recent price breakout suggest Dogecoin may test new highs, breaking past $0.60 resistance.
- A potential golden cross between the MA50 and MA200 could signal the start of a bullish trend for Dogecoin.
Dogecoin (DOGE) appears to be on the verge of a new bullish phase, according to crypto analyst JavonTM1. Based on its historical performance, Dogecoin is showing signs of gearing up for a potential move to new all-time highs.
Price patterns and market movements suggest that the meme coin might be entering a critical stage before an upward rally. Historical price trends, support and resistance levels, and key indicators all seem to point toward a bullish reversal. As of now, the market awaits confirmation of this trend.
Historical Patterns and Breakouts
Dogecoin has shown multiple price breakouts after periods of consolidation, typically marked by falling wedge patterns. In 2015, the price surged from below $0.0005 after consolidating. This was followed by another breakout in 2017 when Dogecoin shot up from the $0.0002 to $0.02 range.
A price jump occurred in 2021, with Dogecoin spiking from $0.01 to nearly $0.60. Notably, current patterns echo past movements, with a recent breakout followed by price consolidation around $0.06178. Such accumulation phases have historically preceded large price rallies.
Key Price Levels and Indicators
Support levels for Dogecoin have been found at critical points like $0.0002, $0.02, and more recently at $0.05–$0.06. On the flip side, the previous peak near $0.60 serves as a resistance level. The falling wedge patterns that have appeared in the past are repeating, signaling potential bullish reversals. If the market continues this pattern, it could break through historical highs.
Moving Average Analysis
A price chart featuring two moving averages, the MA50 (red) and MA200 (yellow), offers further insight into Dogecoin’s recent price action. The MA50 crossed below the MA200 in June 2024, forming a death cross, indicating a bearish trend.
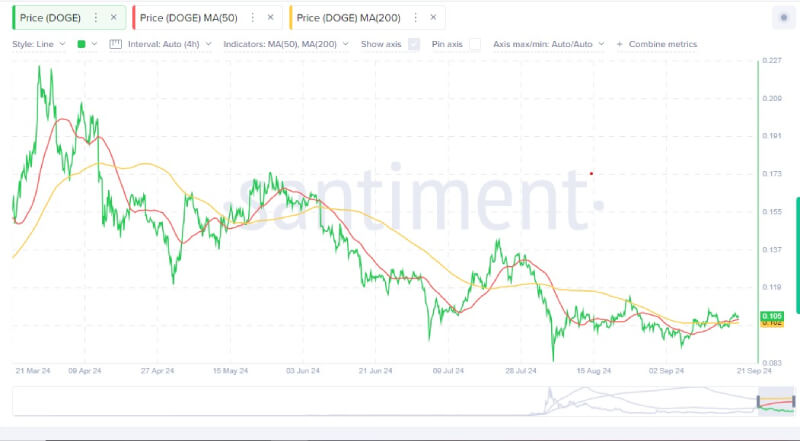
However, recent price movement shows signs of consolidation, with the current price sitting at $0.105. Both moving averages are converging, suggesting a possible trend reversal. If the MA50 crosses above the MA200 (a golden cross), it could mark the beginning of a new bullish phase for Dogecoin.