
- XRP consolidates at $2.82 with buyers targeting a $3.00 breakout amid market stabilization.
- Indicators like RSI at 58 and MACD nearing crossover strengthen prospects for a reversal setup.
- Whale inflows and rising accumulation point toward long-term upside if $3.20 and $3.60 break.
XRP is trading around $2.82, showing signs of stabilizing after a prolonged downtrend. The chart indicates a possible reversal setup, with buyers closely watching the $3.00 zone as the next target. A clean breakout from the current consolidation could trigger bullish momentum and set the stage for renewed growth.

XRP Holds Support and Eyes $3.00
The four-hour chart recorded XRP near $2.8211, moving within a range of $2.8175 to $2.8264. Price movements earlier showed a shoulder pattern near $3.30 before a market downtrend took shape. Multiple consolidation zones reflected fluctuations across sessions, with support now seen around $2.70.
Resistance remained near $3.10, where repeated attempts to advance had failed. Current consolidation between $2.82 and $2.89 suggests market stabilization. According to an analysis prepared by BitGuru, buyers are aiming for the $3.00 area as the next technical target. A close above $2.90 would confirm momentum toward this level.
Indicators show conditions aligning for a potential reversal. The RSI stood at 58, signaling neutral-to-bullish momentum. Meanwhile, the MACD histogram moved closer to a bullish crossover. Recent candles displayed small-bodied moves followed by aggressive closes, adding strength to the reversal outlook.
Accumulation and Long-Term Outlook
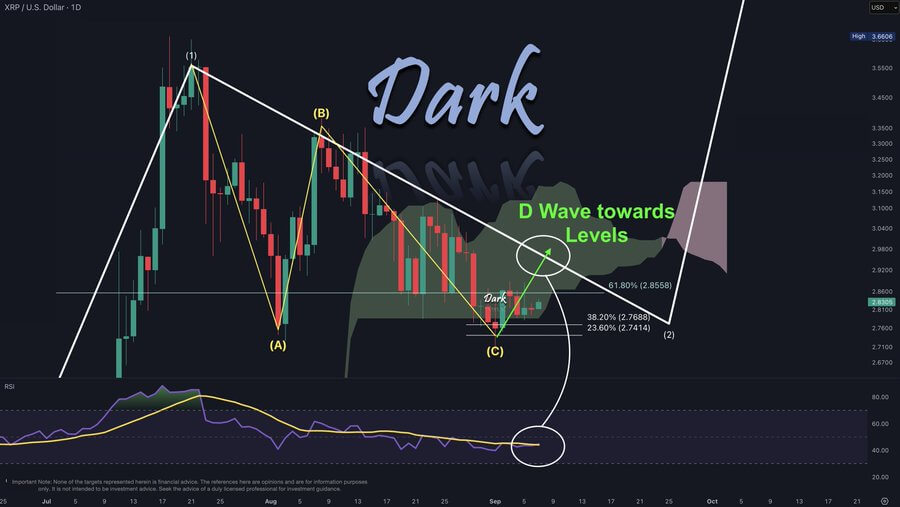
Accumulation data shows rising investor activity. According to an observation by Dark Defender, XRP is poised to retest the $3.00 weekly resistance line. Reports noted 1.7 million tokens purchased in the past month, with whale inflows of 340 million XRP recorded.
The Network Value to Transactions ratio reached a two-month high, pointing to stronger network valuation relative to activity. Analysts note this pattern has often preceded upward moves. A clean breakout above $2.89 may lead toward $2.95 and extend to $3.04.
Support remains near $2.70, with stronger levels at $2.63 and $2.50. A move below these would shift sentiment. Longer-term projections suggest possible advances toward $4.00–$4.50 if resistance near $3.20 and $3.60 are cleared. Upcoming regulatory decisions on ETF approvals in October may add to momentum.