- XRP trades around $2.82 with immediate support at $2.80 and resistance at $3.00–$3.10, showing consolidation after recent highs.
- Fibonacci levels show $0.937 as a breakout level, with long term predictions pointing toward $3.41 and $12.18.
- RSI at 44.41 and bearish MACD show weak momentum, while volume decline shows reduced activity in the short term.
XRP has retreated from its August peak, with the price now consolidating near the $2.80–$2.90 range. At press time, the token was trading at $2.83, slightly above the session low of $2.8092. This cooling phase follows a rally above $3.50 earlier in the summer.

According to analyst Egrag Crypto, the retreat shows “gravity doing what it does best,” emphasizing that profit taking by weaker hands often drives such pullbacks. Long term holders, however, are expected to view these retracements as tests of conviction.
Fibonacci Levels and Key Price Zones
The Fibonacci retracement outlook shows key support and resistance areas. The 0.236 retracement is at $0.257, noted as strong historical support. Higher levels include $0.382 at $0.421, 0.5 at $0.629, and 0.618 at $0.937, considered the breakout levels.
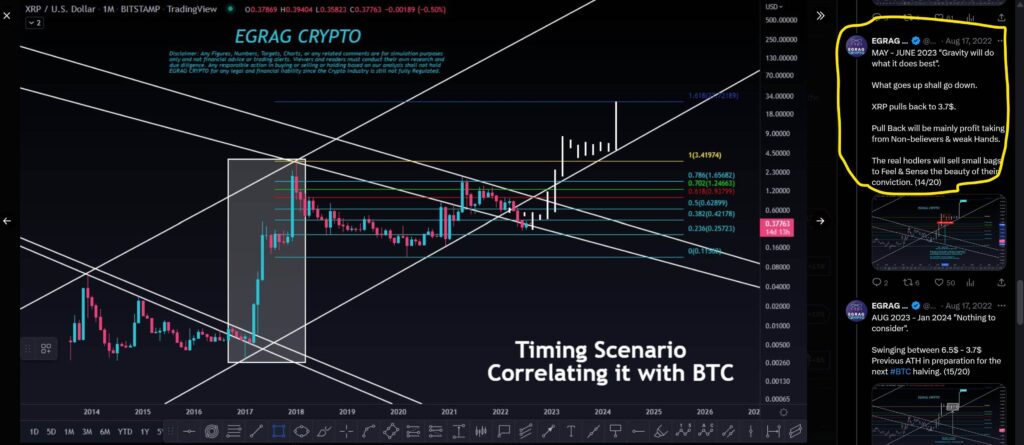
Beyond these, the 0.786 retracement is at $1.656, with extensions projecting to $3.41 and $12.18 in a longer term cycle. Analysts link these levels with timing scenarios around Bitcoin’s halving phases, which have historically influenced broader crypto momentum.
Current Indicators Show Weak Momentum
Momentum readings show caution in the short term. The RSI is at 44.41, slightly below the neutral 50 mark. This level suggests sellers maintain control, although the token is not oversold.
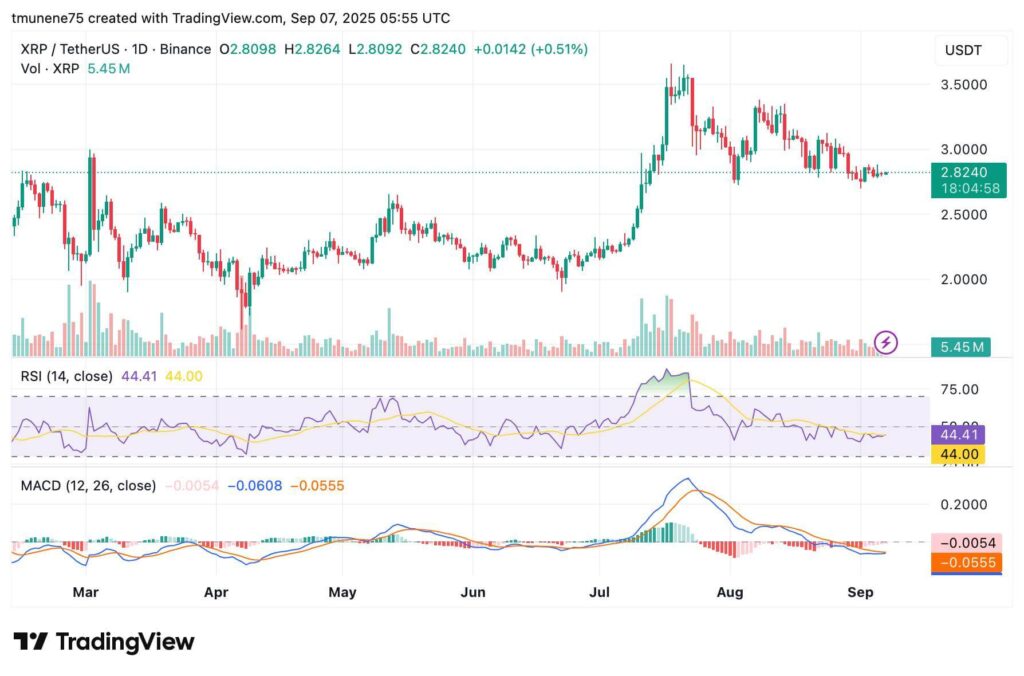
The MACD lines show a bearish crossover, with the blue line at -0.0608 and the signal line at -0.0555. However, the narrowing histogram at -0.0054 suggests selling pressure may be easing. Daily trading volume at 5.45 million is lower than activity during the July to August surge, indicating declining activity.
Support and Resistance Levels
The $2.80 level acts as the immediate support, with a breakdown risking moves toward the $2.50–$2.60 range. Resistance is between $3.00 and $3.10, while a push above $3.20 would lead to retest ofAugust highs.
Analyst Egrag Crypto noted that surges near $3.70 would mainly result from profit taking by short term holders. Meanwhile, conviction among long term holders is expected to be key in sustaining any future uptrend.