
- Ethereum is holding steady as buyers step in around $4,300 and $3,400, keeping hopes alive despite tough resistance near $4,800.
- Ethereum’s steady climb with higher highs shows traders remain confident, using the trendline as a guide for continued strength.
- Even while stuck below $4,800, Ethereum still shows strong buyer interest and past buy zones hint at more upside potential ahead.
Ethereum faced a sharp pullback on September 4, 2025, yet analysts continue to highlight its resilient technical setup. According to Kraken data, ETH traded at $4,326.62 at the time of the analysis after shedding $123.38 in value, a 2.77% daily decline.

With a high of $4,480 and a low of $4,269 during the day, there was considerable volatility. Ethereum’s long-term trajectory still shows a strong bullish trend, bolstered by recurring buy zones and a powerful ascending diagonal pattern, despite recent short-term setbacks.
IncomeSharks, a well-known crypto analyst, shared insights on X, stressing that Ethereum often appears weak at buy zones before recovering strongly. The chart analysis reveals multiple buy opportunities that validated this pattern.
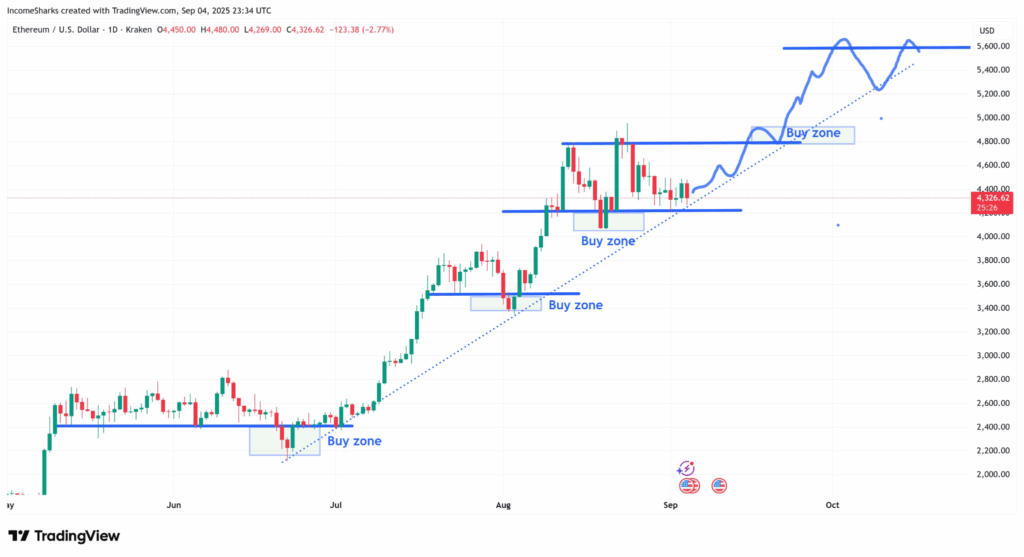
Source: IncomeSharks
The first came at $2,400, followed by a consolidation phase near $3,400. More recently, the $4,800 level emerged as the latest buy zone, forming a critical resistance area that traders now watch closely.
Trendline and Market Structure
Ethereum’s price action continues to respect a clear ascending trendline extending across the chart. This diagonal support has consistently cushioned pullbacks.
Additionally, the structure is dominated by higher highs and higher lows, which reinforce the current upward trend. Deeper retracements have been averted and market players’ confidence has grown as a result of each decline attracting buyers at higher levels.
The trend is also supported by volume dynamics. Long runs of green candlesticks were followed by observable spikes in trading activity when breakouts above resistance zones occurred.
Red candlesticks are showing up more regularly as sellers test the strength of resistance, but recent action near $4,800 has shown consolidation pressure.
Path Ahead for Ethereum
Ethereum’s latest trading captured in the chart shows the crypto trading at a crucial decision point of around $4,800. As a result, the market may see extended sideways movement or a breakout over resistance. If the market continues to decline, traders can rely on levels between $4,300 and $3,400.
Despite encountering resistance near $4,800, Ethereum’s resilience and trader confidence are evident as it keeps rising. The market will probably determine whether ETH breaks higher or keeps moving sideways in the upcoming weeks.