
- Bitcoin forms inverse head and shoulders pattern with neckline breakout near $110K, supporting bullish technical pattern.
- RSI at 45.98 shows neutral momentum, while MACD histogram turns positive, hinting at possible recovery signs.
- Key support is at $110K, while resistance at $122K defines the next decisive move for Bitcoin’s movement.
Bitcoin is consolidating above a key support level after breaking through a major technical formation earlier this summer. According to analyst Javon Marks, the digital asset surged off support zones, a move he described as the possible beginning of a larger bull phase.
He suggested the present trend could go up higher than any all time highs, with projections at $135,000 or more in the near to medium term. Recent price action, chart pattern and technical analysis suggest bullish potential and risk of more severe corrections depending on how support holds.
Breakout Pattern Emerges with Neckline Retest
A notable inverse head and shoulders pattern has developed, typically viewed as a bullish reversal structure. The shoulders formed around $85,000 to $95,000, while the head dipped lower near $72,000 to $75,000.
A breakout above the neckline, between $108,000 and $110,000, was seen mid July when Bitcoin rallied to $122,000. Price then reversed back after the rally and tested the region of the neckline again, with the support still holding firm at $110,000 to $112,000.
Momentum Indicators Show Mixed Signals
Following the July peak, momentum has weakened, though not decisively bearish. The RSI 14 is at 45.98, slightly below its moving average of 50.84. This places momentum in the neutral zone, leaning slightly bearish, but still far from oversold levels.

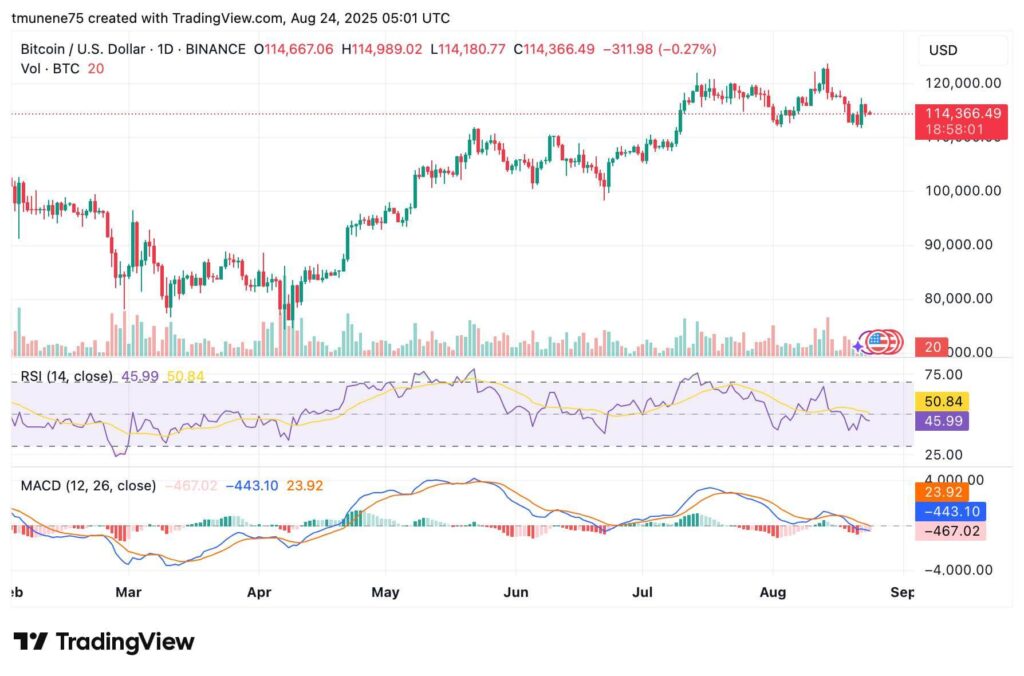
The MACD shows calm momentum, with the two lines minus zero. However, the histogram was positive at 23.81, which shows early indications of likely bullish crossover if there is a continuous upward trend. Such inconclusive readings show that despite easing buying strength, there is scope for recovery if support levels are maintained.
Key Levels Define Next Move
The short term pattern shows Bitcoin consolidating between $112,000 and $115,000 after peaking near $122,000. Key support is at $110,000, a level tested during the recent retest of the neckline.
Resistance is near $120,000 to $122,000, where July rally stalled. If the price holds above the $110,000 threshold, continuation toward higher levels remains possible, with targets beyond $130,000 to $135,000 as outlined by Marks.
However, a breakdown below $110,000 may reopen the path toward $100,000 to $105,000. With consolidation persisting, the market is near a decisive move, guided by these support and resistance zones.