
- Altcoin market cap dipped by 1.45% to $1.02T but held above key $1T support, suggesting bullish structure remains intact.
- RSI and MACD show cooling momentum, yet no trend reversal, suggesting a healthy consolidation phase after overbought levels.
- Lower trading volume and higher lows confirm structural strength, with long term resistance near $1.75T still in possible.
Altcoins continue their upward movement despite a brief dip, with the total market cap excluding Bitcoin and Ethereum holding above $1 trillion. Following a multi month rally, the market reached a high of $1.10 trillion.

However, it pulled back by 1.45% on July 24, with a loss of $14.79 billion. The dip brought the market down to $1.02 trillion, but support at the $1T level has remained firm. Technical indicators suggest the market is undergoing a healthy cooldown after a prolonged bullish phase. Analysts attribute the correction to profit taking and resistance pressure. Still, price structure and momentum remain largely intact.
Higher Highs Confirm Bullish Macro Structure
Data from the three day timeframe shows the market moving within a broad ascending channel since 2023. The upper resistance of this channel is near $1.75 trillion, which now acts as a long term target.
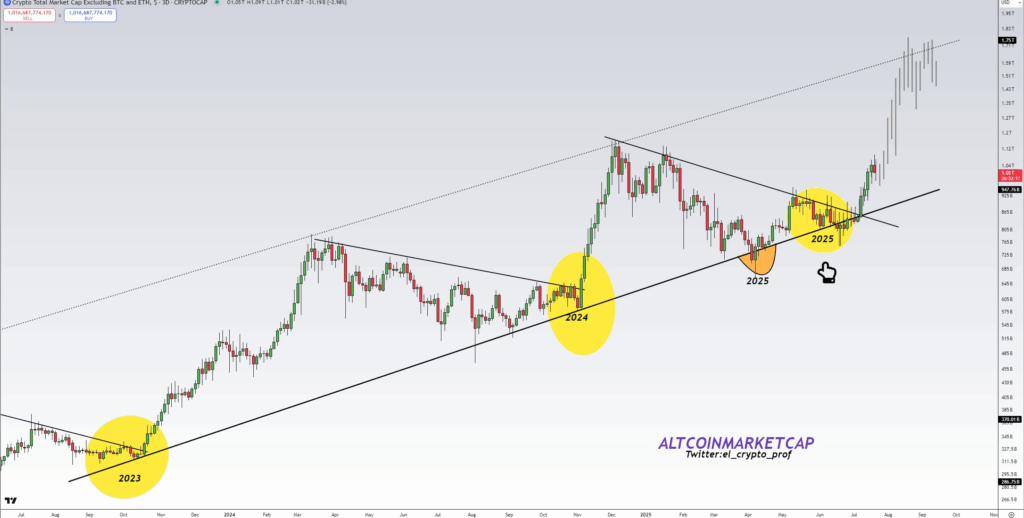
Breakouts in late 2023 and again in October 2024 helped push the market cap to $1.2 trillion by early 2025. The market saw a clear retest of the $370 billion breakout zone in 2023, which led to a rapid ascent.
Another rounded retest near $730 billion in mid 2025 confirmed higher lows, strengthening bullish continuation patterns. Price trades near $1.02 trillion, consolidating after reclaiming the psychological $1T mark.
Technical Indicators Show Momentum Is Cooling
As per the latest daily timeframe data, the RSI dropped from an overbought peak of 76.11 to 61.76. This decline suggests cooling momentum without breaking the bullish structure. A further drop toward 50 could signal deeper consolidation, though not necessarily a trend reversal.
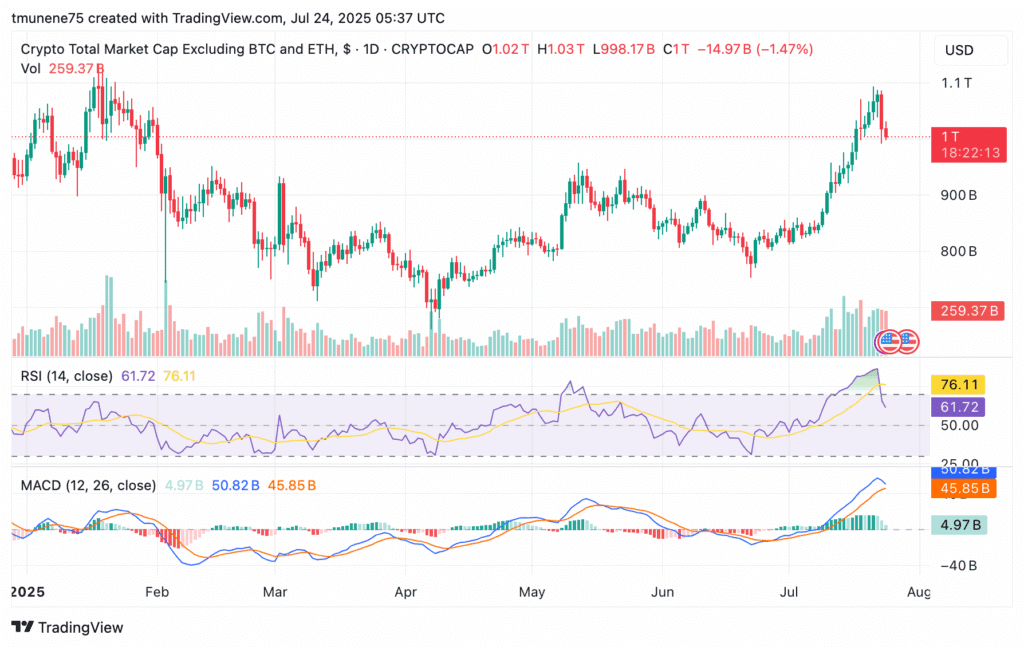
Meanwhile, the MACD remains in bullish territory with the line at 50.83B still above the signal line at 45.85B. However, the narrowing gap and shrinking histogram indicate fading momentum. If the market cap fails to stay above $1.03 trillion, bearish pressure may rise.
Support Zones Hold Despite Decreased Trading Volume
Volume dropped to 259.37B, well below the levels seen during the initial breakout. The decline in trading activity supports the idea of a temporary pullback rather than a broader selloff.
A sustained hold above $1 trillion keeps the bullish trend intact, with near-term resistance at $1.10 trillion and secondary levels at $1.27 trillion. On the downside, a break below $998B could send prices toward $950B or even $920B.
The altcoin market has retained its upward structure through a series of successful retests, breakouts, and critical support holds. While momentum cools, structural strength remains evident across both macro and daily timeframes.