
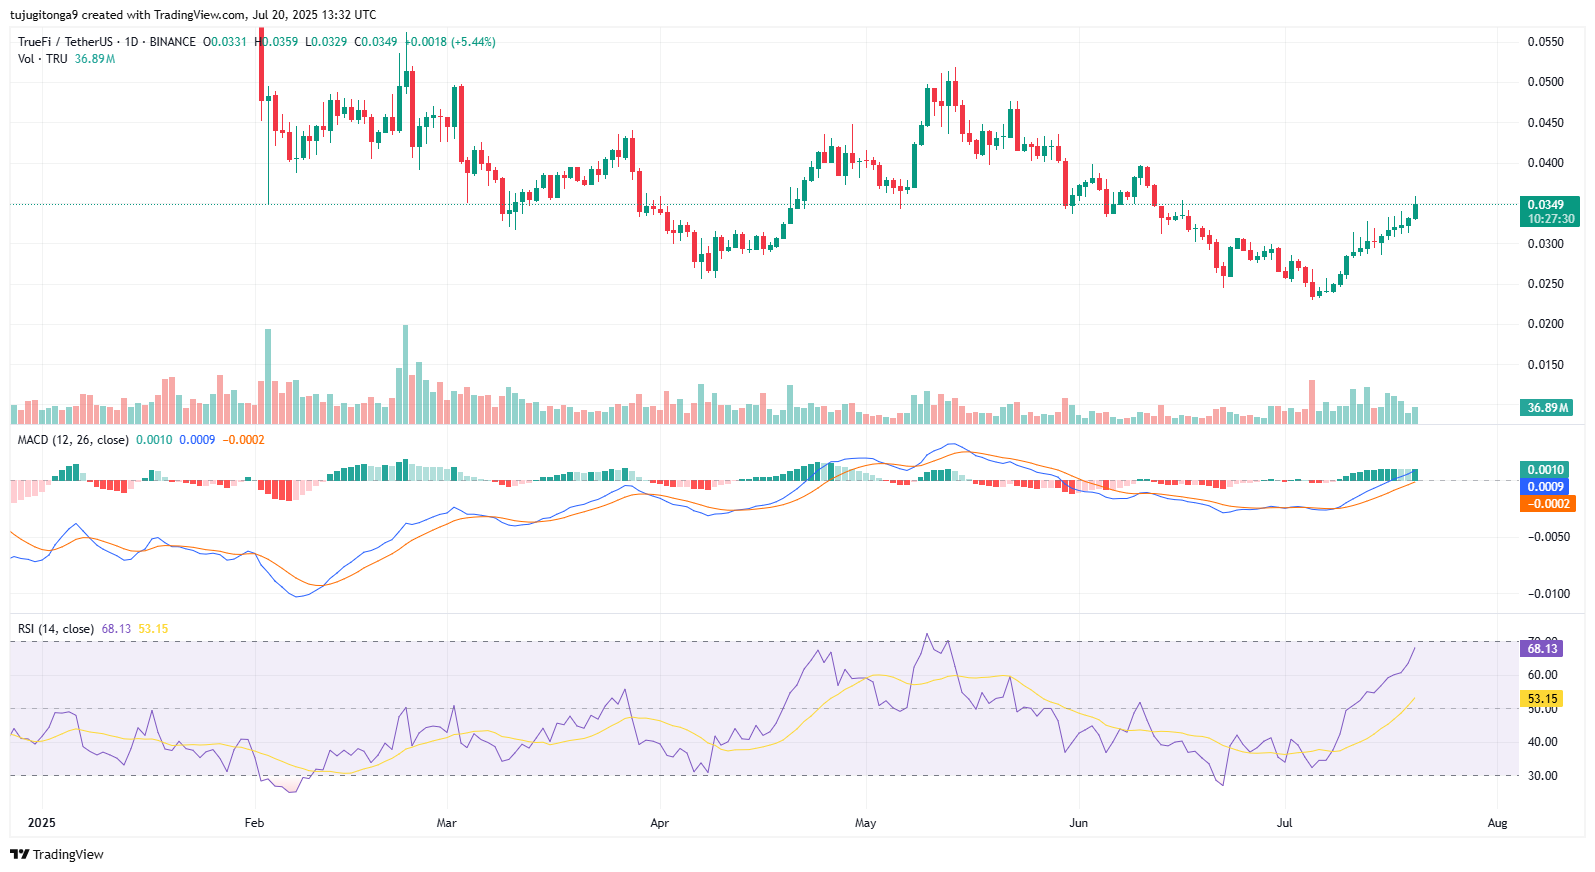
- TRU surpasses a long-term downward-facing trendline, suggesting a reversal may be present with increasing bullish momentum and confirmation of volume.
- MACD bullish crossover above zero and expanding histogram indicate an upturn in market sentiment and strength of buy-in as well.
- RSI at 69.66 reflects strong demand; a breakout above 70 may signal continuation toward the projected $0.070 price target.
TrueFi (TRU) has ignited a significant bullish breakout on the daily timeframe, creating new momentum in the altcoin. The price broke above a long-term descending trendline that had been limiting price gains for months. This change is an important technical development as TRU moves into a possible reversing phase.
The daily close above the trendline confirms buyer strength and signals the end of the prevailing bearish structure. TRU is trading at $0.0356, up 7.55% as of writing, backed by a 33.53M volume surge. Notably, this momentum has emerged after weeks of higher lows and increasing demand.
Analyst Highlights Breakout Momentum
ZAYK Charts pointed out TRU’s daily breakout, noting it as a potential launchpad for a 121% move from the current price. The breakout above $0.031–$0.033 may push TRU toward its projected $0.070 target.
Besides, the rally features strong bullish candles that show continued buying interest. The recent price surge reflects an 11.38% gain over 24 hours and a 15.80% rise over the week.
Moreover, volume and sentiment now favor bulls. However, a healthy retest remains possible. A dip back to the $0.031–$0.033 zone could offer a strong bullish arguement
Indicators Signal Strong Bullish Shift
Technical indicators suggest bullishness. The MACD bullish crossover above the zero line indicates the strength of momentum. The histogram continues to grow indicating continued upside momentum.
The RSI is now at 69.66, almost in overbought territory. The RSI reasonably high stature indicates aggressive buying, and it would also suggest that a short-term consolidation may take place. The length to a more extended rally may only be a level above 70 The way I see it is RSI needs a level above 70 to create a longer rally.
For this reason, keep an eye out for pullbacks or pauses. A brief pullback or pause is often a precursor to a more substantial continuation move.
Retest or Rally: What Comes Next?
TRU’s structure leans bullish, but a trendline retest would be structurally healthy. A dip toward former resistance now turned support could shake out weak hands.
However, if price falls back under the trendline with high selling volume, it may signal a false breakout. Consequently, a confirmed retest will offer higher-probability trade setups.
Overall, TRU shows clear trend reversal signs with solid confirmation. Traders should prepare for a potential breakout continuation, backed by strong fundamentals and technical momentum.