- LINK breaks above $15 resistance, signaling potential rally toward $17.50–$20 target zone.
- Technicals show bullish momentum with golden cross, MACD crossover, and rising RSI.
- On-chain data improves, but volume drops 50% while price holds above key support levels.
Chainlink (LINK) has broken above the $15 resistance level, which acted as a ceiling in recent weeks. The price action shows continued strength, and indicators now point toward a potential rally toward the $17.50–$20 region if the current trend holds.
Technical Setup and Momentum Indicators
LINK is currently trading near $15.31 after a weekly rise of over 16%, with momentum supported by a bullish technical setup. According to analysis prepared by Ali Charts, the price has broken above the $15 resistance, increasing the probability of further gains toward the $20 range.
The ascending channel on the chart remains intact, with LINK trading near its midline. Jonathan Carter stated that LINK is breaking out of a long-term descending triangle pattern and now faces resistance around $15.50.
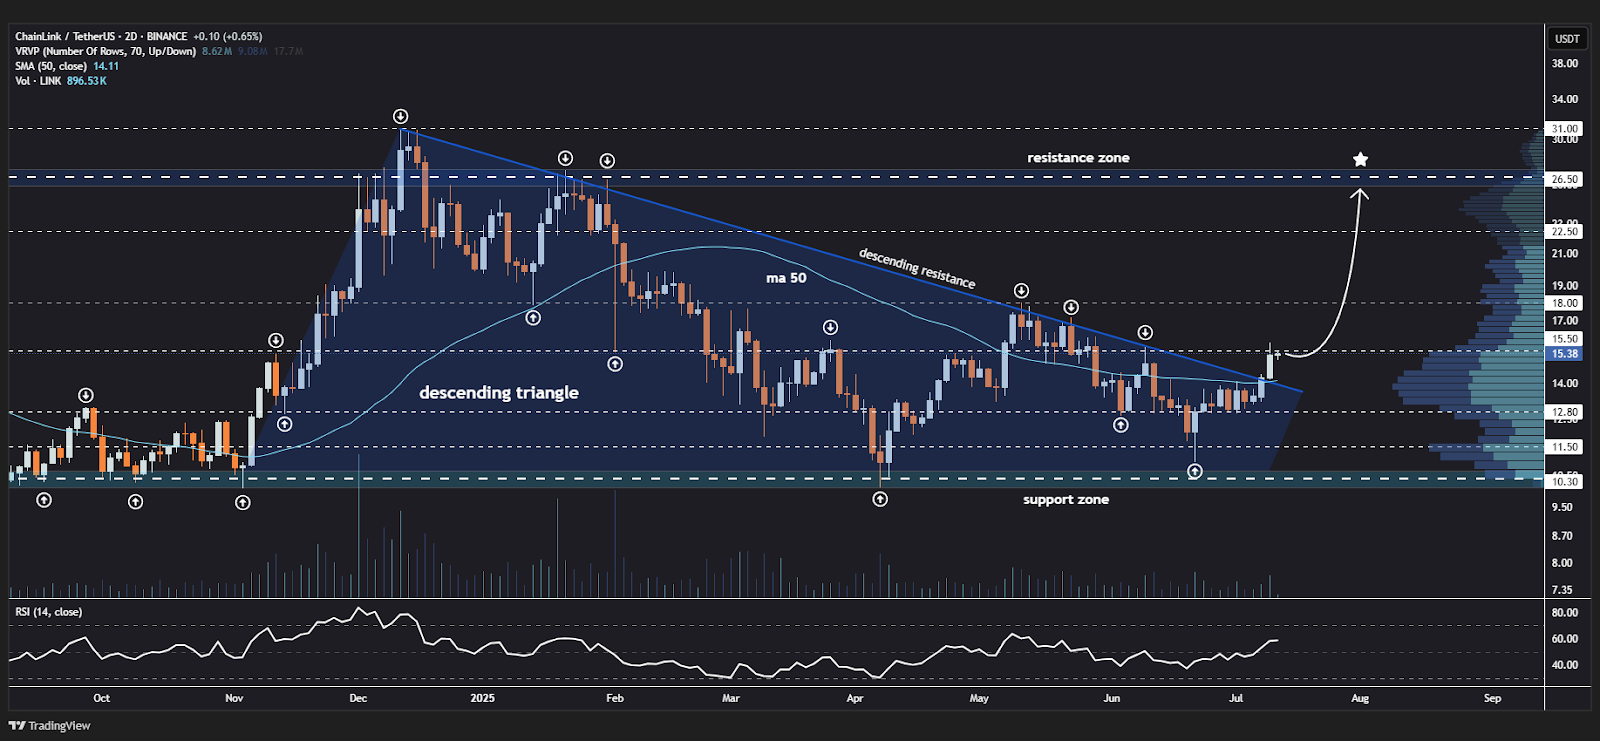
The recent golden cross, where the 50-day moving average crossed above the 200-day, supports a longer-term positive outlook. The MACD shows a bullish crossover while the RSI approaches overbought levels, suggesting strong upward pressure may continue in the short term.

On-Chain Data and Support Zones
Chainlink’s active addresses are increasing, showing stronger network use compared to previous weeks. However, they remain below the highs seen in 2021 and early 2023. Network growth also shows an upward trend, reflecting broader engagement but not yet at peak expansion rates.
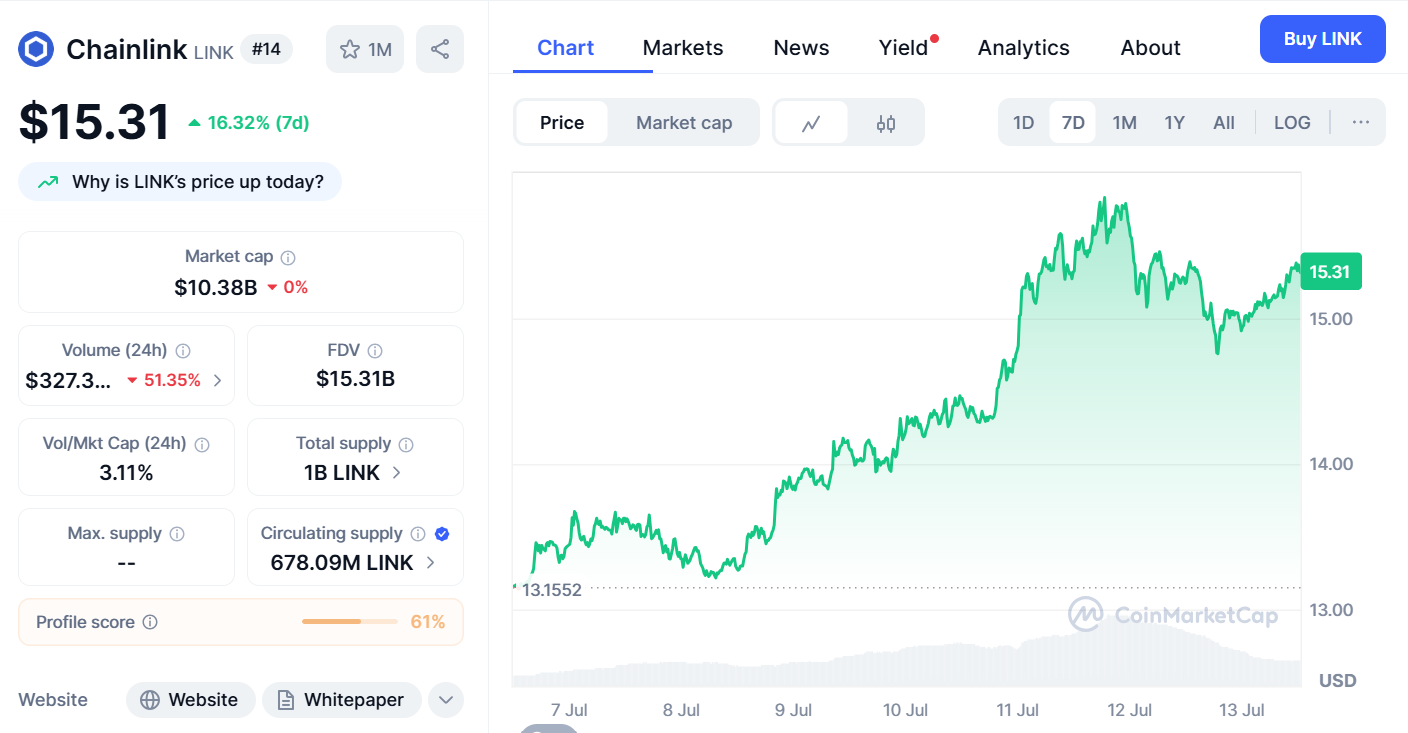
The $15 price, which previously acted as resistance, now serves as support. Below this, another support zone remains at $13.60. According to recent volume data, daily trading volume stands at $327.3 million. Although this marks a decline of over 50%, the price continues to hold above key levels, showing stability.
As long as the current price action continues to move, the price has further resistances between the levels of $17.50 and $20. According to analysis prepared by Ali Charts and supported by chart structure, Fibonacci levels around $18.11 and $21.00 could become targets in upcoming sessions.