
- Dogecoin forms a bull pennant on the 1H chart, with traders watching $0.173–$0.175 for breakout.
- Golden cross and rising RSI support bullish outlook, with $0.185 as short-term target.
- Santiment data shows undervaluation and longer holding periods, indicating growing investor confidence.
Dogecoin is showing renewed strength as it trades at $0.1705, with bullish signals forming on lower timeframes. The current structure on the 1-hour chart is forming a bull pennant, following a sharp upward movement. If this pattern confirms with a breakout, traders expect DOGE to reach a short-term target of $0.185.
Bull Pennant Structure Forms as Momentum Builds
According to analysis prepared by Trader Tardigrade, a bull pennant has formed on the Dogecoin 1-hour chart. The pattern is visible after a strong rally, followed by price consolidation within a narrowing range.
This structure is supported by declining volume, which typically aligns with the pattern before a potential breakout. Traders are monitoring the $0.173 to $0.175 zone as a breakout point. If DOGE closes above this area, the measured move projects a short-term target of $0.185.
The recent golden cross on the hourly chart, where the 50-hour moving average crosses above the 200-hour moving average, further supports the bullish structure.

Market Structure and Technical Indicators Align
Dogecoin recently reclaimed support between $0.165 and $0.17 after bouncing from a low near $0.143 on June 22. This support zone previously preceded a strong rally in May, making it an area of interest for traders again. DOGE now trades within a broader range of $0.143 to $0.26.
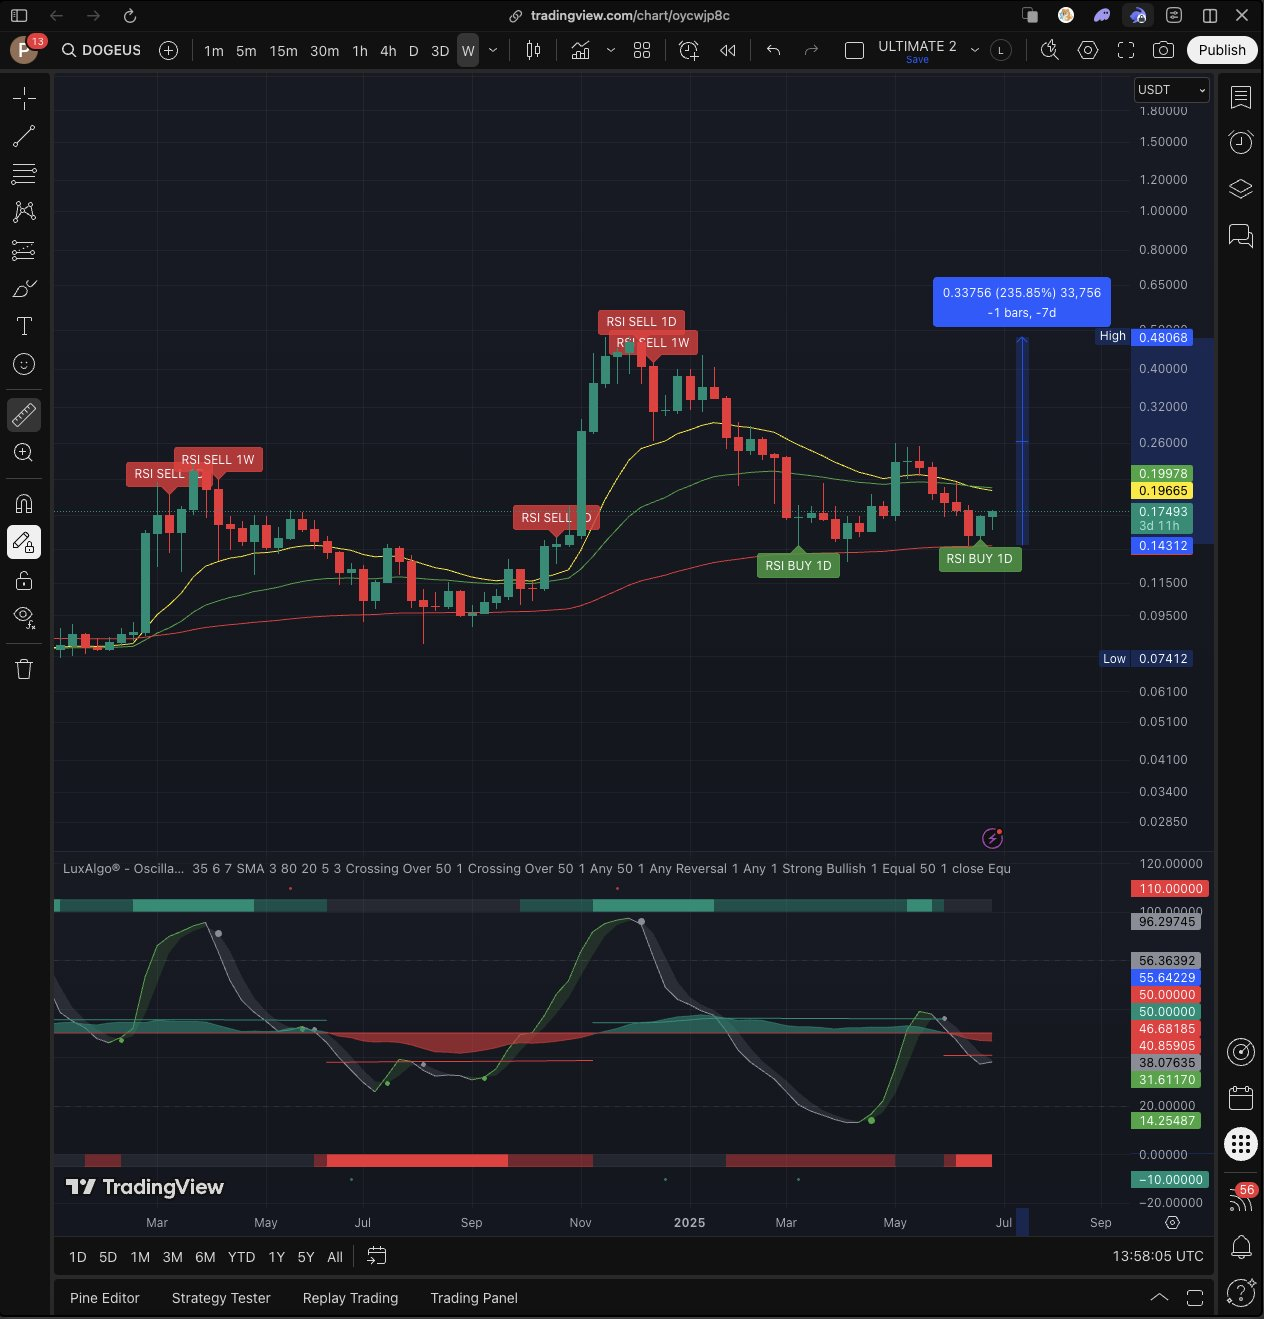
According to PennyBagsCX, “DOGE looks like it is going to bounce to its previous local top of $0.48 in December 2024.” Oscillators are pointing upward, and support at the 200 EMA has held, which strengthens the bullish case. The RSI is also rising, while MACD shows a crossover with green bars on the histogram.
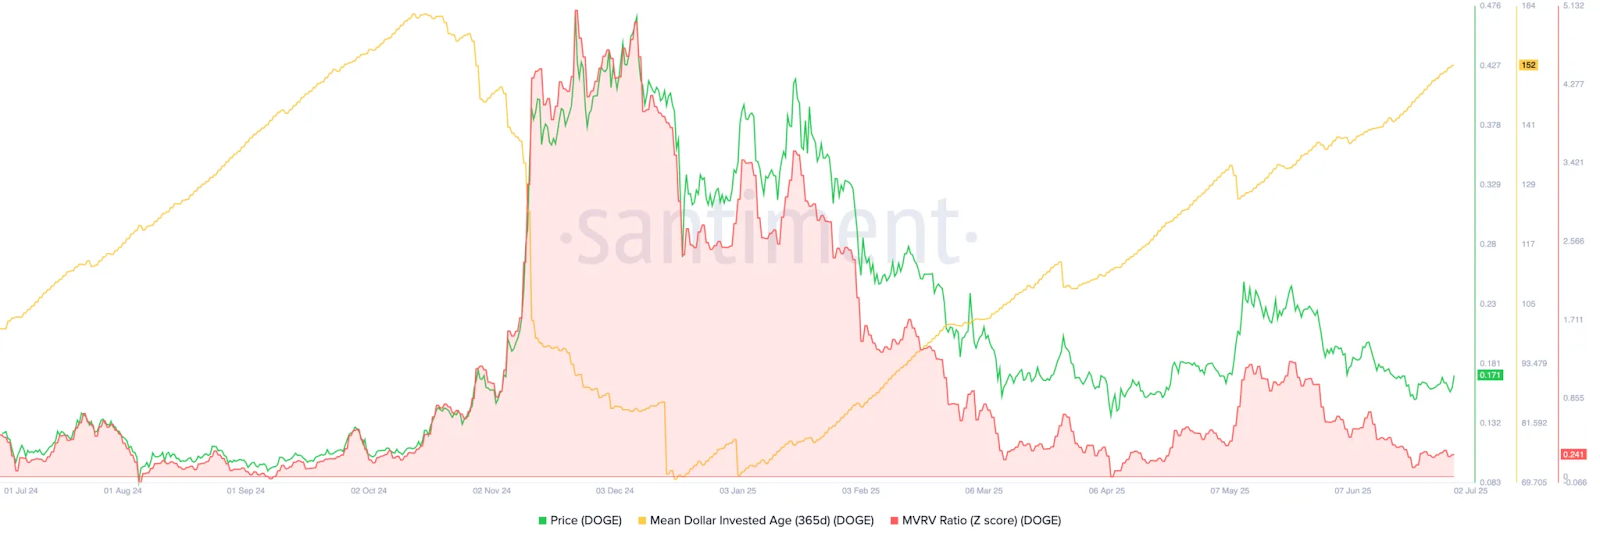
Data from Santiment shows Dogecoin’s MVRV z-score has dropped to 0.241, signaling undervaluation. The 365-day MDIA has risen to 152, suggesting longer holding periods among investors.