
- Bitcoin is consolidating mid-channel while holding long-term strength, mirroring pre-rally phases seen in past cycles.
- Short-term holders now hold just 12% of profits, while long-term holders dominate with 75%, reflecting market conviction.
- With EMAs rising and speculative signals absent, Bitcoin could be building strength quietly ahead of Q4 price action.
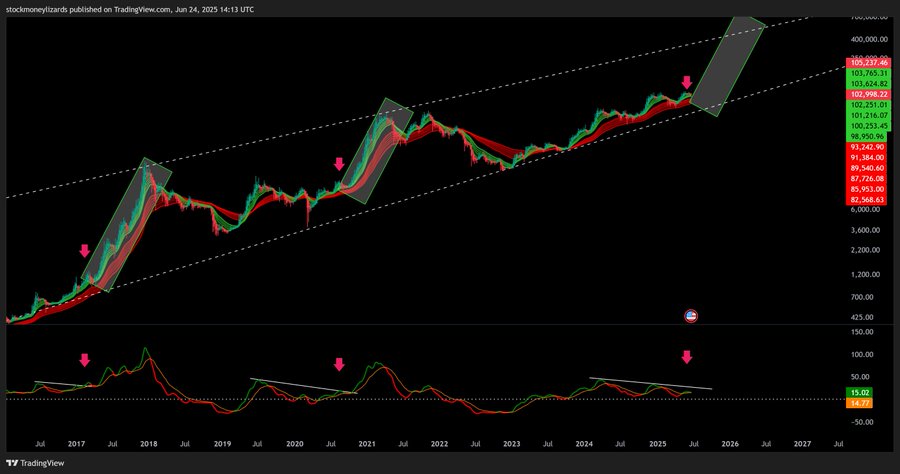
Bitcoin is now trading back at the halfway point of its long-term rising channel, duplicating the price action of previous bull cycles. Trading now in the $65,000–$70,000 range, the cryptocurrency is showing signs of consolidation, but overall technical health is intact. Prior Bitcoin cycles-marked by relentless phases of accumulation, breakout, parabolic expansion, and correction-have all traced out within this very structural channel. This time, the chart is still respecting that formation.
While short-term mood has been tested by near-term volatility, Bitcoin’s longer-term indicators remain consistent with positive momentum. Market participants are watching closely now to see if this consolidation is just a pause for continuation. While it is uncertain when the next breakout will be, the setup is developing on price, moving averages, and on-chain activity.
Structure Holding, Momentum Building Beneath
Bitcoin is holding firm within its historical growth channel, a trendline that has guided price since early adoption. This middle range often acts as a decision zone between consolidation and rally.
Source: (X)
Bitcoin remains below the EMA 10 ($109,727) and EMA 20 ($103,958), limiting short-term upside for now. Still, longer-term EMAs -EMA 50 ($93,221), EMA 100 ($89,746), and EMA 200 ($82,560) – are all trending upward, signaling strong base structure. Previous cycles also showed this exact formation: price pausing mid-channel, while longer-term averages quietly supported continued upside.
This blend of consolidation with strength has played out before. In 2017 and 2020, Bitcoin moved sideways beneath short-term resistance, only to break out as macro conviction returned. The current setup appears to mirror that history, with structure still in place and pressure building below.
Holder Psychology Reveals What Charts Don’t
As Bitcoin’s chart signals equilibrium, deeper clues emerge from profit distribution data across different investor classes. These shifts tell a story that price alone cannot.

Short-term holders now account for just 12% of realized profits, down sharply from earlier cycles where they made up over 60%. Meanwhile, long-term holders are holding firm, controlling 75% of all profitable Bitcoin supply. The analyst points out that this divergence has frequently marked periods where conviction outweighed fear.

Source: Alpharactal
What’s more, the chart shows no signs of euphoric clustering, often visualized as purple circles at cycle tops. That absence is telling. It implies Bitcoin hasn’t yet reached the speculative extremes seen in previous peaks. This has analysts wondering: Is Bitcoin quietly setting up its next move while emotions remain neutral?
With structure intact and holding behavior consistent, Bitcoin remains in a technical zone that historically precedes major trends. As Q4 approaches, analysts are watching for the moment when price, sentiment, and structure align once again.