
- Chainlink forms a strong base at $11 as technical patterns and volume suggest a potential trend reversal toward the $30 zone.
- LINK breaks its long-term downtrend and enters accumulation phase, setting up for a rally backed by growing trader confidence.
- Momentum indicators and historical data align as LINK shows signs of bottoming out with $81.65 flagged as a potential longer-term target.
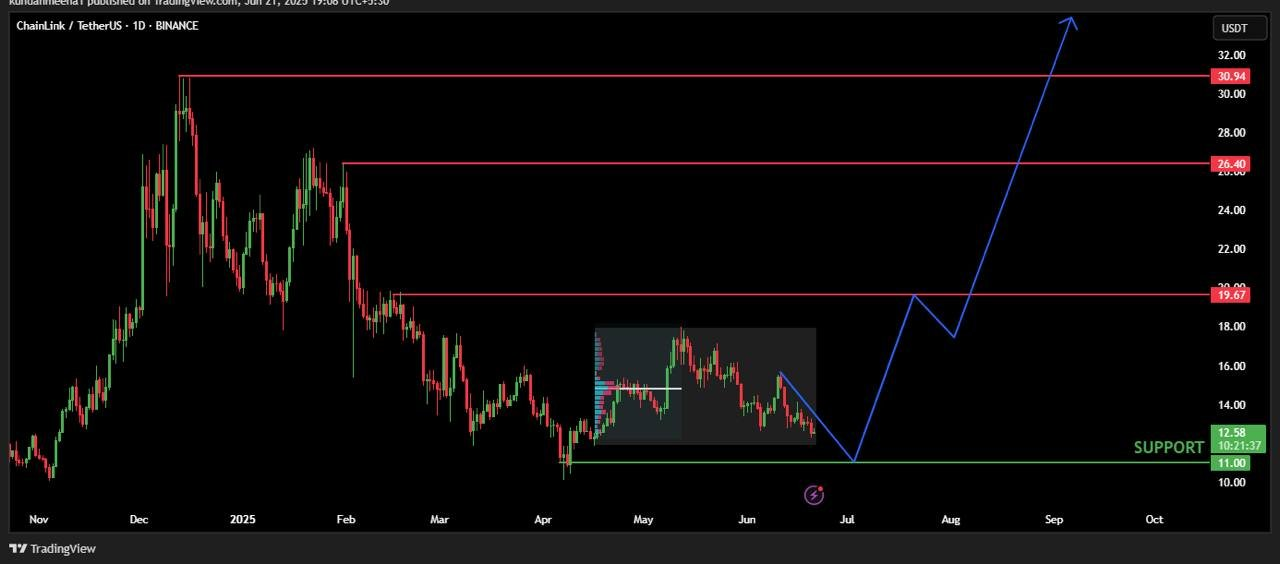
Chainlink (LINK) is trading at a support zone around $11.00, sparking growing interest from market participants. According to CryptosBatman, this range mirrors the zone where LINK began its last major rally. The price has been bleeding slowly, yet it now sits on a solid historical base. If this area holds, the next logical upside target lies near $19.00. LINK has corrected over 60% from its early 2025 highs above $30.00. This aligns with typical post-parabolic retracement patterns, increasing the likelihood of a near-term bottom.
Source: CryptosBatman
Descending Channel Break Spurs Bullish Shift
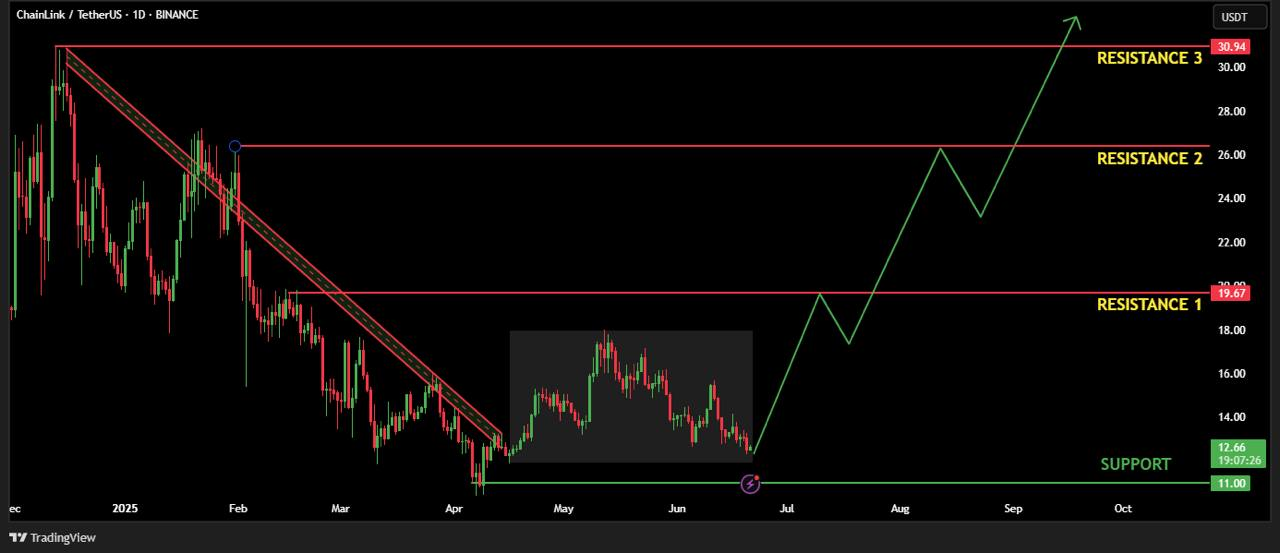
The daily chart highlights a descending price channel that contained LINK’s correction for months. LINK dropped systematically from $30.94 to current levels near $12.00. Multiple rejection wicks and resistance touches near $19.00, $26.00, and $30.94 confirm the structure’s validity. However, LordOfAlts points out that LINK recently broke this long-standing downtrend. The price now consolidates inside a clear accumulation range. Historically, such phases precede powerful upward moves.
Source: LordOfAlts
Besides, past data shows LINK tends to explode after long periods of inactivity. The current technical setup features significant support at $11.00–$12.66. This level also served as a base for institutional accumulation during previous cycles. Volume indicators confirm rising participation during each support test, signaling growing trader interest.
Technical Momentum and Market Sentiment Improve
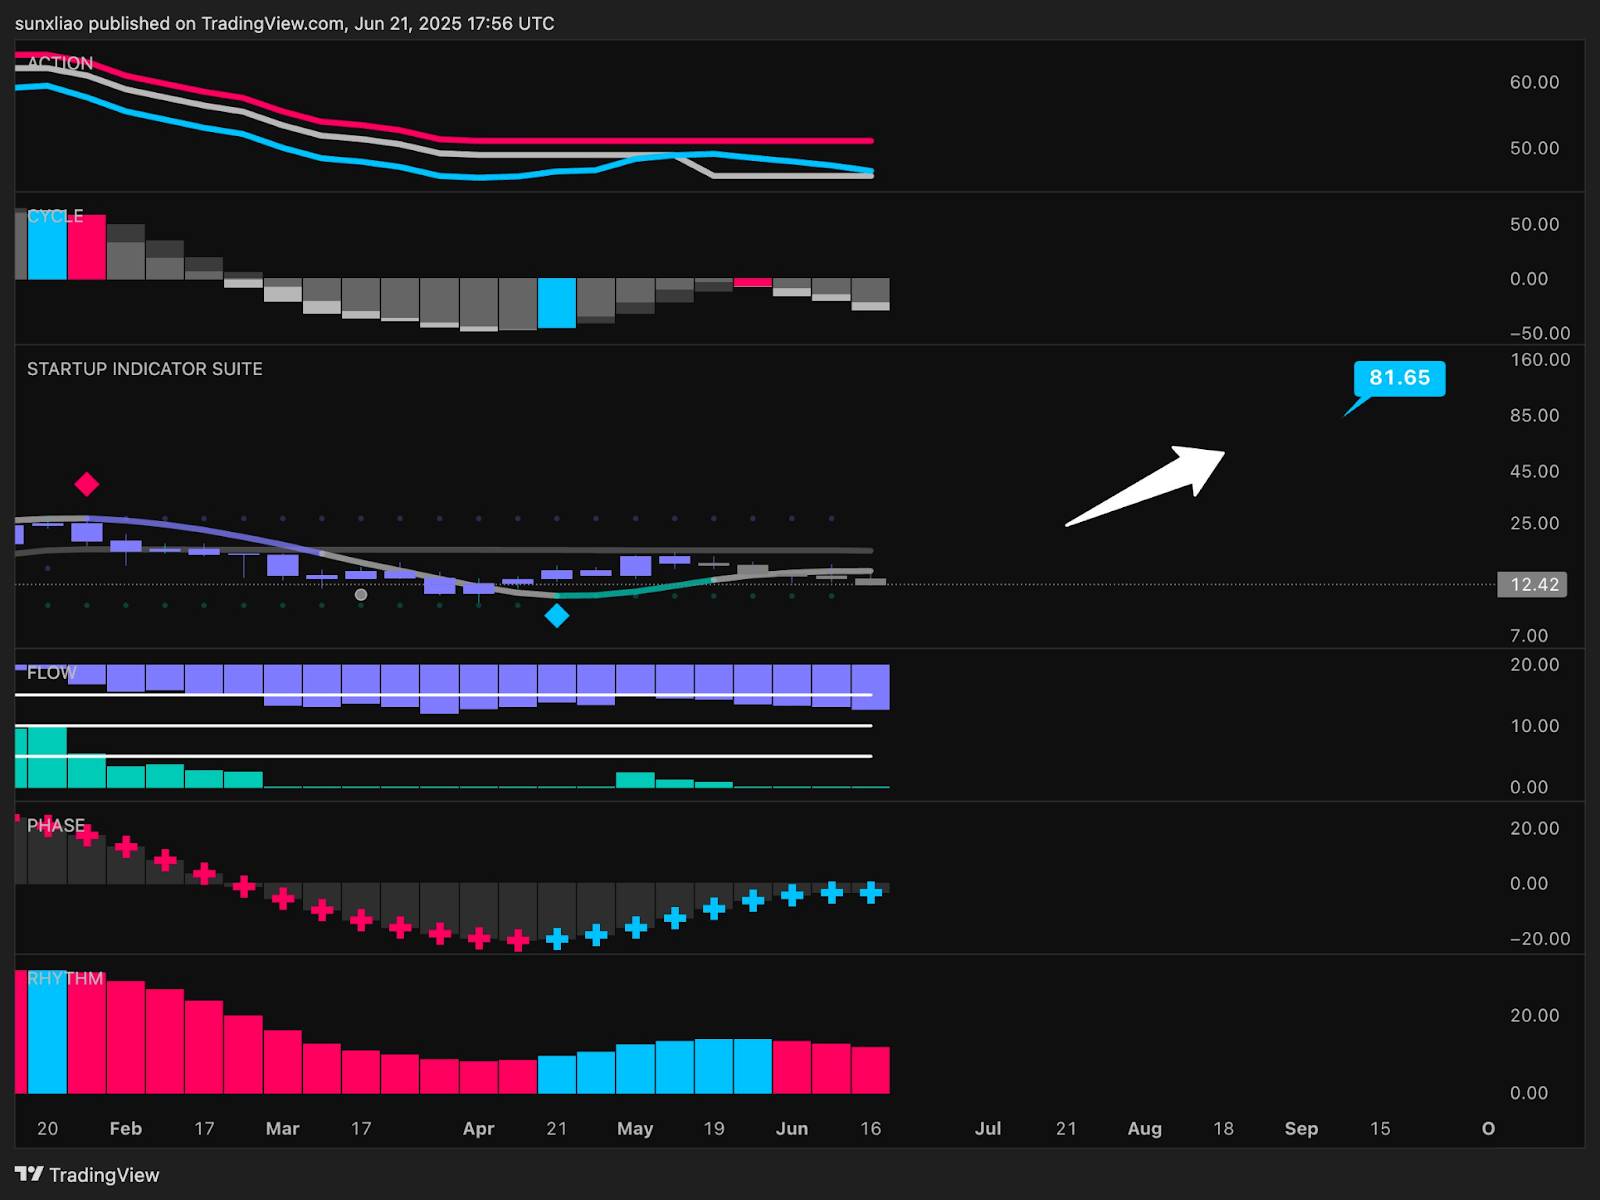
Moreover, Sun Liao’s June 21 chart analysis shows LINK transitioning through momentum and sentiment cycles. The Startup Indicator Suite targets $81.65, reflecting rising bullish potential. Positive phase shifts appear across the Cycle and Rhythm indicators. Consequently, this confirms a pivot in sentiment and volume behavior. These signals often precede trend reversals in major altcoins like LINK.

Source: Sun Liao
Additionally, the presence of multiple blue bars in flow metrics suggests renewed market strength. Recent rhythm shifts display increased volatility, yet with bullish hints. Hence, technical indicators now lean toward a potential recovery phase.
Chainlink remains one of the most prominent oracle projects. Despite the drawn-out correction, its technical structure now provides a solid risk-reward profile. If momentum sustains and confirmation follows, LINK could realistically revisit the $25.00–$30.00 region in the months ahead.