- XRP futures surged to $3.96B as price consolidates near the key $2.14 resistance level.
- Long/short ratio rose to 1.035, signaling growing bullish sentiment among XRP traders.
- Technical indicators suggest XRP is in a breakout setup, with support holding strong at $2.14.
XRP has maintained its position near the $2.13 mark, confirming projections made in November 2024. Current market behavior validates the 6-month forecast that placed $2.14 as a pivotal level. As of June 20, 2025, XRP is showing patterns consistent with the expected trajectory, indicating that prior analysis remains on track.
Surge in Futures Volume Reflects Strong Trader Activity
According to data compiled by Ripple Van Winkle, XRP futures volume surged to $3.96 billion in just 24 hours. Binance accounted for over 30% of that volume, followed by Bybit and OKX. Open interest also increased by $550 million, with traders showing stronger confidence in the asset.
The price action suggests XRP is consolidating just below resistance between $2.14 and $2.18. This zone has been tested multiple times in recent sessions. The Bollinger Bands are tightening, and the Relative Strength Index (RSI) sits at 52, which suggests that the token may be preparing for a breakout.
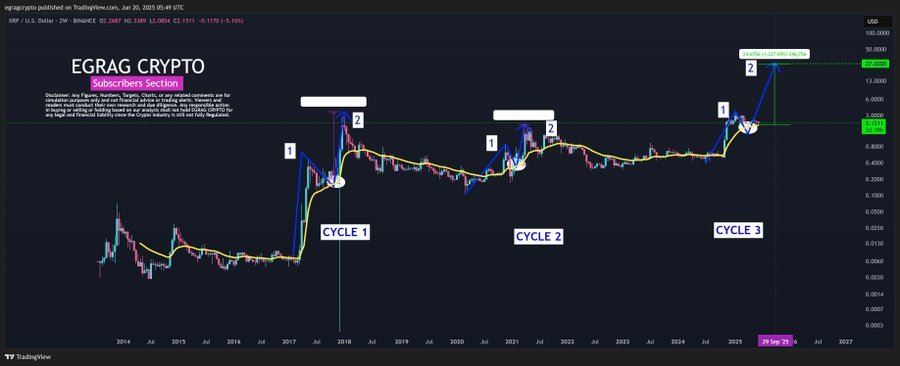
According to analysis prepared by Egrag Crypto, the $2.14 zone forms part of a larger structure. He projects long-term targets of $11.50, $27, and even $42. This outlook is based on historical fractal patterns that mirror XRP’s previous rally from 2017.
Technical Indicators Point to a Breakout Setup
XRP has formed an ascending channel with support holding at $2.14 during high-volume sessions. Coinglass data shows that the long/short ratio has risen to 1.035. This is the highest in nearly a month and shows that traders are increasingly taking long positions.
The projected price structure from November 2024 is now showing signs of materializing. The support zone between $1.99 and $2.09 remains intact. If this holds, the setup favors a bullish continuation.
XRP’s price structure remains aligned with past breakouts. The current trading pattern reflects a stable trend within key support and resistance levels, with volatility expected to increase in the coming days.