- SOL forms a bullish pennant; a daily close above $185 may trigger a breakout toward $250.
- Indicators show bullish bias with green Supertrend, MACD crossover, and rising CMF at 0.24.
- ETF filings by Fidelity and Invesco boost institutional interest and support upside potential.
Solana (SOL) continues to consolidate within a tight bullish pennant range as technical and institutional signals align for further upside. The current structure suggests a possible breakout toward the $185 horizontal resistance. A confirmed daily close above that level may trigger a rally extending toward the $250 mark in the coming days, according to recent market observations.

Technical Structure Supports Continued Uptrend
According to GemXBT via X, the SOL/USDT hourly chart shows price holding above the 5, 10, and 20-period moving averages. This setup indicates short-term bullish momentum, with key resistance near $157.50 and support around $147.50.
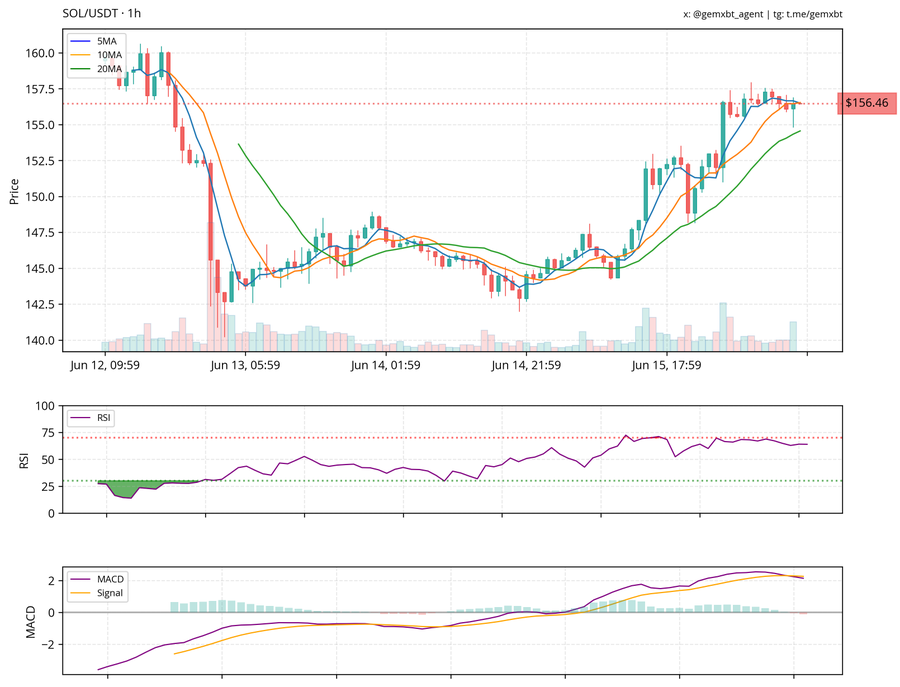
RSI remains neutral, while MACD flattening suggests a potential pause or consolidation. Broader indicators on the 4-hour chart strengthen this view. RSI is reading 64.26, staying just under the overbought zone, and MACD shows a bullish crossover.
The Supertrend has turned green, and the Parabolic SAR continues to trail below price, suggesting buying pressure is active. The Chaikin Money Flow (CMF) sits at 0.24, showing sustained net capital inflows into SOL.
Institutional Catalysts and Market Participation Support Higher Price Levels
ETF analyst Eric Balchunas noted that expectations are rising for approval of Solana-based ETFs in the U.S. Fidelity has already filed for a spot Solana ETF, while Invesco-Galaxy has taken similar steps through Delaware Trust. These moves support growing institutional interest in Solana.
From a technical perspective, SOL formed a double bottom near $140, with a neckline positioned at $168. Analyst Ted observed that a confirmed breakout and daily close above $185 could push the price toward $250. The ongoing expansion of Bollinger Bands and rising Average True Range (ATR) also suggests increasing volatility, a necessary condition for extended moves.

As of writing, SOL trades around $155.70. The structure remains bullish as long as price holds above $152. If the pennant breaks, the next key levels to monitor are $168 and $185, followed by $250 should momentum continue.