
- Ethereum is anchored at $2,320–$2,370 support as analysts eye a possible push to $3,000 in case levels hold firm against descending triangle dynamics.
- Market Watchers cite the 4-hour 200 EMA as pivotal dynamic support, summoning a bullish reaction to $2,800–$3,073 in the event of further consolidation.
- Long-term prospects are pointing to structural strength, with predictions of $4,000 in Q3 2025 being backed by both historical trends and Gaussian channels.
Despite recent volatility, Ethereum has a strong horizontal support area of $2,320 to $2,370. Key price areas are being monitored by analysts for a bullish turn towards $3,000 in case support is maintained.
Descending Triangle Structure Holds Market Attention
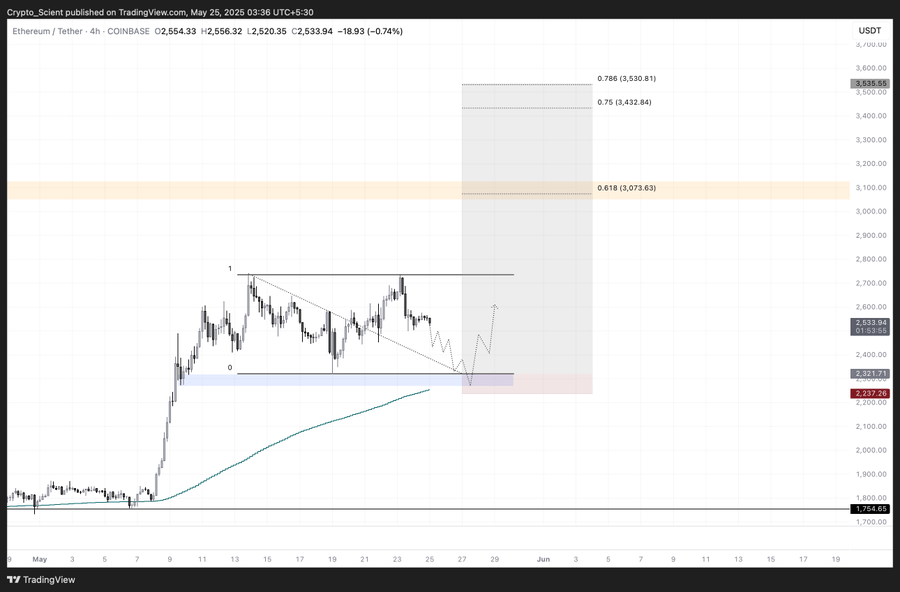
Ethereum has remained within a descending triangle pattern following a pullback from highs near $2,800. The setup has kept price action compressed, with buyers defending key zones amid short-term retracements. A break above the pattern may trigger a rally toward major Fibonacci levels.
A potential swing-long setup has surfaced as market participants assess price behavior near the 200 EMA. The technical structure signals a consolidation phase, while Ethereum remains above its 4-hour 200-period EMA. According to Crypto_Scient, this support alignment could enable a bullish bounce after early-week pressure.
Source: X
The analyst has presented a clear strategy that involves bidding in the lower range between $2,320 and $2,370. This area overlaps with the 4-hour 200 EMA, offering dynamic support in line with historical levels. The analyst also pointed out that if Ethereum bounces from this confluence zone, a leg toward $2,800 could develop fast.
Scient’s chart includes a projected path showing a temporary dip into the lower band followed by a swift move higher. The Fibonacci retracement levels suggest a possible target around $3,073 at the 0.618 zone. The analyst’s technical view supports a short-term pullback followed by higher lows, keeping Ethereum within a larger bullish continuation.
Long-Term Trends Suggest Structural Resilience
Ethereum’s broader trend remains intact, with price still inside a multi-year channel showing steady upward momentum. Analysts are highlighting recurring breakout zones from historical patterns, noting similarities in current price action compared to prior cycles.

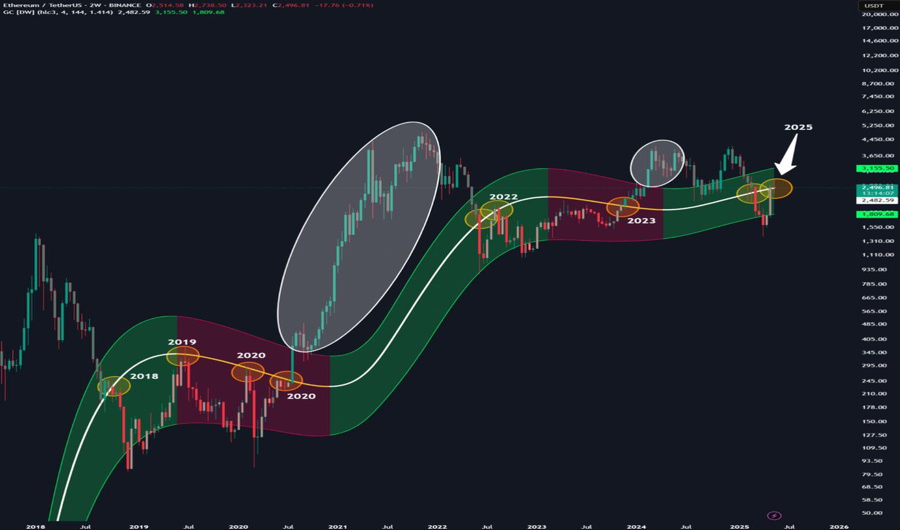
Cas Abbé has provided additional insights using the two-week Gaussian Channel on ETH/USDT. The analyst’s analysis places Ethereum above the white mid-band, historically associated with rally phases. The analyst observed that past reclaim events in 2020 and 2024 both resulted in surges above $4,000.
Source: X
The analyst noted that Ethereum sits in the green band, historically seen as a bullish zone between $2,100 and $3,150. The analyst’s chart suggests Ethereum may aim for $4,000 by Q3 2025 if this reclaim holds. The upward ribbon slope reinforces long-term support, indicating a possible continuation phase if higher lows persist.
What Analysts on X Are Saying About ETH’s Setup
Technical traders on X are tracking Ethereum’s structural resilience above the $2,449 mid-band and local Fibonacci supports. Many see the current position as a decision point between bouncing continuation or a broader breakdown. Several noted that a confirmed hold above $2,800 could activate higher Fibonacci levels and restart bullish momentum.