
- XRP faces strong resistance at $0.75, with crucial support at $0.4761 determining its next price movement.
- RSI and MACD indicators signal mixed momentum, with a potential bullish crossover if XRP holds above current levels.
- A break above $0.75 could lead XRP to $1, but failure to maintain support could result in a retracement to lower Fibonacci levels.
Crypto analyst RippleXrpie predicts that XRP could soon see a short-term pump to $0.75 before potentially climbing higher to $1. Currently, XRP is trading at 0.5677, with the market displaying notable activity that could pave the way for this bullish movement.
Key Technical Levels to Watch
The price chart reveals critical levels that are likely to influence XRP’s next move. Notably, the price is facing resistance at 0.7500 USDT, marked as an Equal High (EQH), which could challenge the upward momentum.
This level is expected to act as a strong barrier where selling pressure might increase. Conversely, a crucial support level is identified at 0.4761 USDT, referred to as the Critical Support Level (CISD). This level has historically held the price, indicating that a drop below this point could signify a bearish trend.
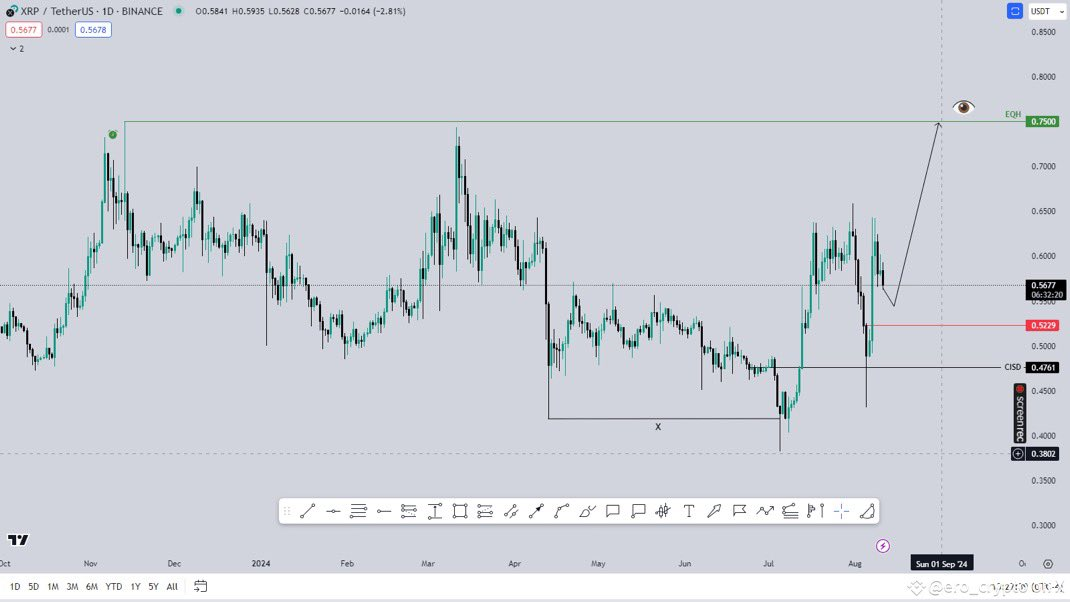
Source: JackTheRippler on X
In addition to these levels, a support zone between 0.3802 USDT and 0.4761 USDT is marked on the chart, highlighting a potential area where the price might stabilize if it declines.
Indicators Signal Mixed Momentum
Technical indicators on the chart present mixed signals regarding XRP’s momentum. The Relative Strength Index (RSI), currently at 48.84, is below the neutral 50 mark, suggesting a slight bearish or neutral momentum. However, the RSI is not in the oversold or overbought territory, indicating room for movement in either direction.
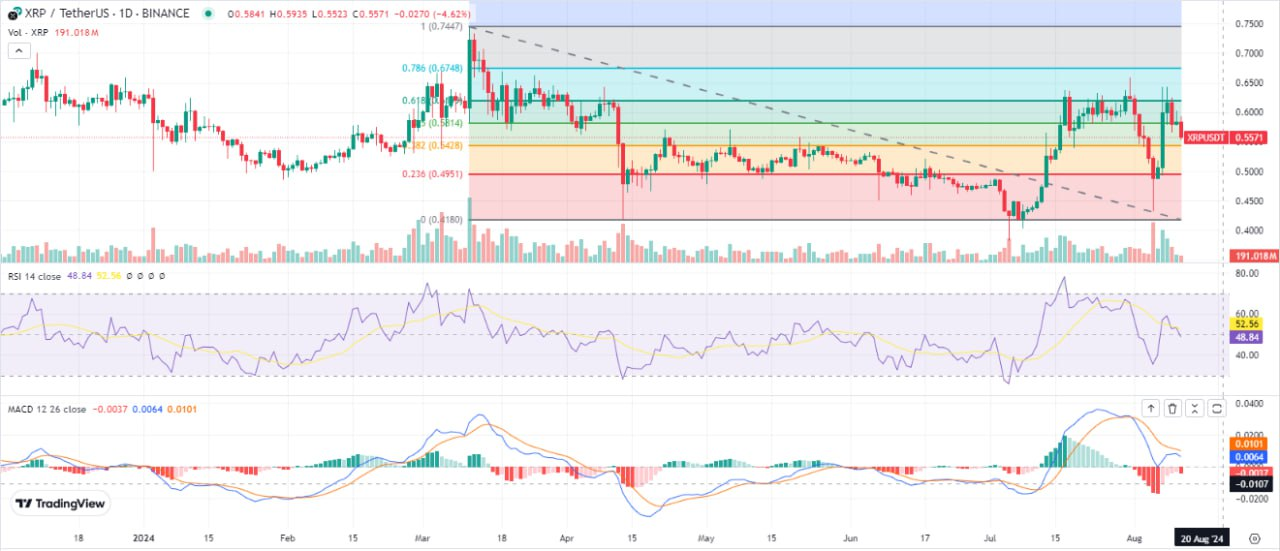
Source: CryptoRank
Meanwhile, the Moving Average Convergence Divergence (MACD) shows slight bearish momentum, as it is below the signal line. However, the convergence of the lines hints at a possible bullish crossover if the price begins to rise.
Potential Scenarios for XRP’s Next Move
The chart analysis suggests two potential scenarios for XRP. If the price manages to break above the 0.7500 resistance level, it could pave the way for further gains, possibly towards the 1 USDT mark. However, if XRP fails to hold above the current support levels, it might retrace to lower Fibonacci levels, such as 0.5428 USDT or even 0.4951 USDT.
The upcoming price action for XRP hinges on its ability to maintain support above critical levels while overcoming resistance. The market’s next move will be crucial in determining whether XRP will reach RippleXrpie’s predicted targets.