
- According to TD Sequential analysis Sonic may be starting to recover which indicates that downward pressure should weaken.
- The RSI indicator currently resides in its neutral region without indicating powerful buying signals.
- Current price consolidation at a lower level within Bollinger Bands indicates that market pressure could sustain its downward direction.
The cryptocurrency market remains volatile, with price swings creating opportunities for traders. Sonic (SONIC), a digital asset that has seen fluctuations in value, is currently trading at $0.01722, reflecting a 2.5% increase in the past 24 hours. Recent market movements indicate that SONIC could be primed for a potential rebound, as suggested by the TD Sequential indicator on the daily chart.

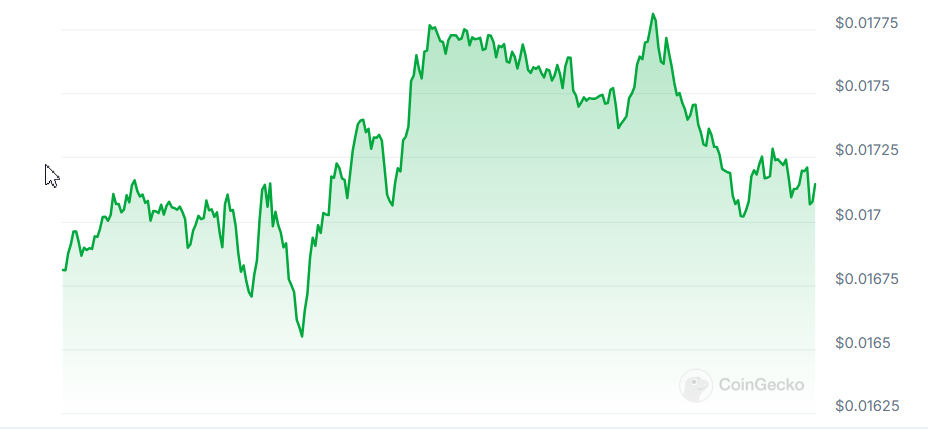
Source:Coingecko
Sonic Flashes Bullish Signal
The Sonic price has demonstrated moderate movement with a range from $0.01655 to $0.01781 during a 24-hour period. The price stability remains moderate based on technical assessment signals but future momentum appears likely to change. The bullish signal has appeared through the TD Sequential indicator.
The chart also provides a visual representation of a separate cryptocurrency’s price action, with a sequence of bearish candles followed by a marked signal indicating a possible upward movement. Based on present market patterns Sonic might be approaching a period of less pressure and the beginning of an upward trajectory.
If the TD Sequential signal is accurate, Sonic could witness a short-term price appreciation, attracting traders looking for bullish momentum. The market shows ongoing uncertainty so a confirmed uptrend requires continued price movements above resistance boundaries.
Sonic Downtrend Persists Amid Neutral Technical Indicators
The Sonic 1-hour chart represents the price action of Sonic has been in a clear downtrend, as evidenced by the declining price action and the sell signal at 0.4230 USDT.
The RSI is at 47.70 which suggests that the asset is neither in overbought nor oversold territory but is moving within a neutral zone. The RSI has attempted ascents but fails to break the 60 level which indicates weak market momentum for bullish movement.

Source:TradingView
Price action stays close to the lower band of Bollinger Bands while bands contract downward along with a bearish trend confirmed by their downward slope. Sonic has maintained its position near the lower band indicating constant downward market pressure.