

- Ethereum’s Primary wave 5 targets range between $7,000 and $10,000, with a key trend line at $7,500.
- Key support levels for ETH include $881.71 and $2,111.94, while resistance is noted at $4,868.00.
- Despite short-term bearish indicators, long-term outlook remains bullish with significant upward potential.
Ethereum (ETH) is showing signs of a bullish phase, with price movements suggesting a potential upward movement. Analyst PWebborn’s recent update on X highlights completed primary waves and key Fibonacci retracement levels, indicating that Ethereum might be gearing up for substantial gains.
Elliott Wave Analysis and Fibonacci Levels
According to PWebborn, the previous bear market low of 2019 at $81.91 marked the beginning of Ethereum’s journey to its all-time high (ATH) of $4,800. The analysis outlines primary waves 1 to 5, retracing back to $881 in June 2022 during the last bear market. Now, the current position appears to be within Primary wave 4, suggesting an imminent move to Primary wave 5.
The chart details the crucial Fibonacci retracement levels, which include 0.236 at $0.016430, 0.382 at $0.030935, and 0.618 at $0.040319. These levels are essential in identifying potential support and resistance zones, with key resistance observed at $0.041458 and $0.049999. Notably, the main target for this bullish move stands at $0.065393, with a long-term target around $0.300424.
Projected Price Targets and Key Levels
The analysis predicts Primary wave 5 will comprise Intermediate waves 1 to 5. The targets for this final wave range between $7,000 and $10,000, with $7,500 hitting a significant trend line. Additionally, the chart highlights a price target for Wave 5 around $7,542.65, with intermediate targets at the 1.618 level at $3,973.00 and the 2.618 level at $5,123.22.
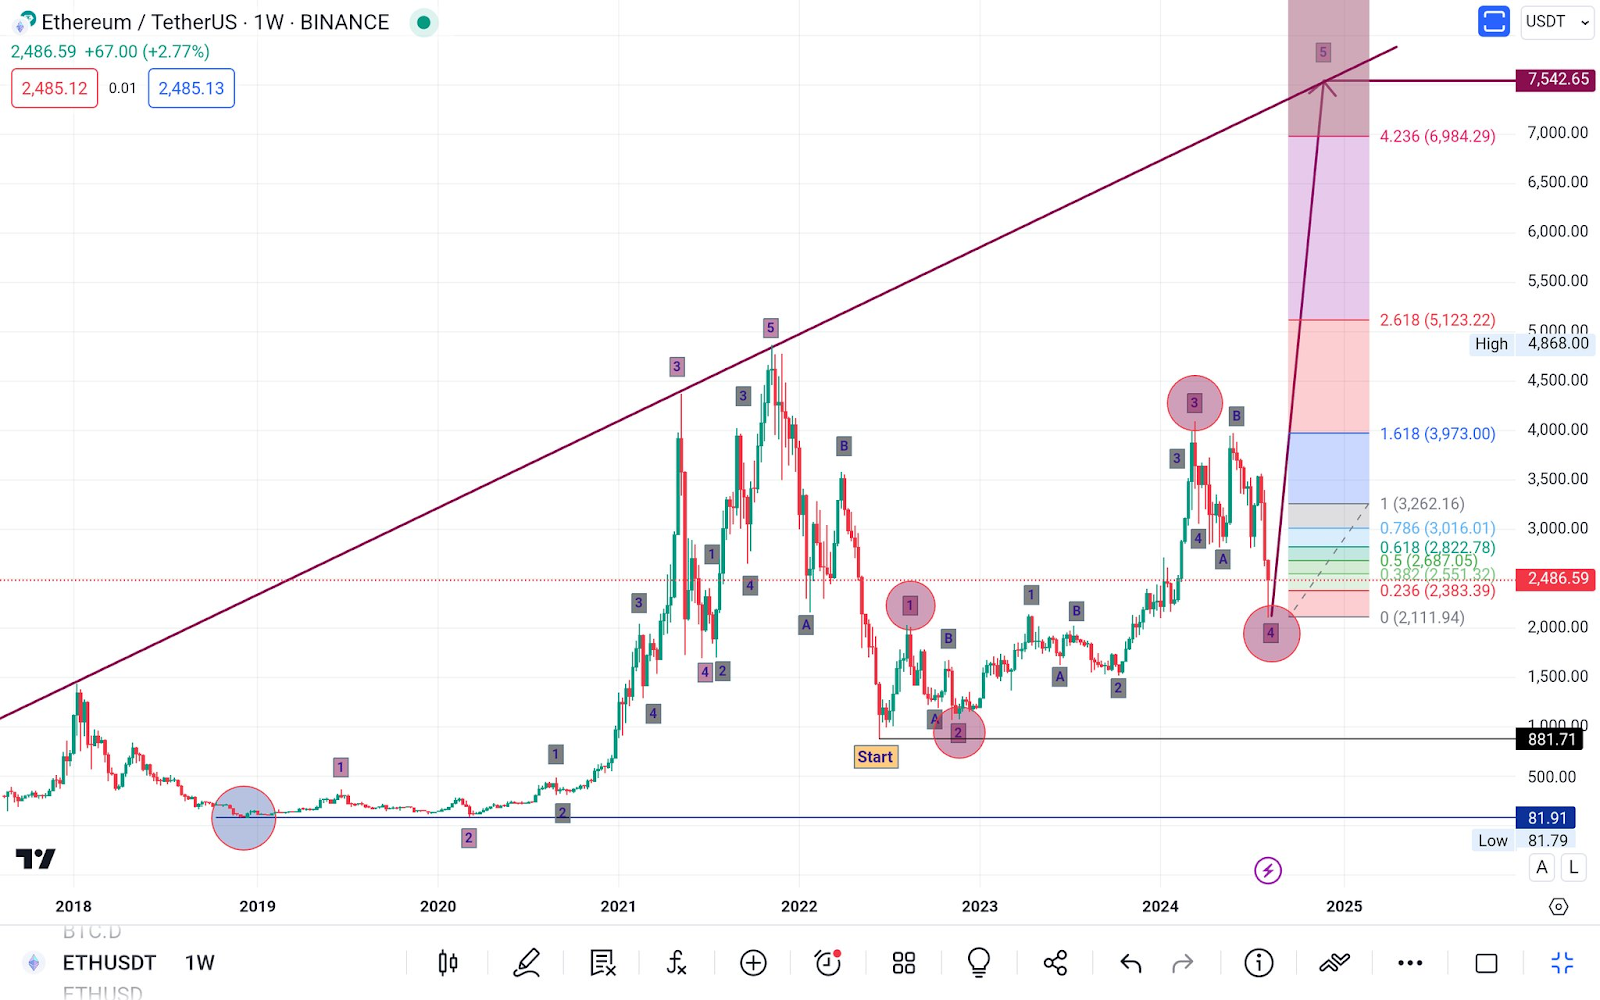
Source: PWebborn on X
Furthermore, a long-term ascending trend line drawn from the 2018 lows through subsequent lows indicates strong support and resistance levels. For example, major support is identified around $881.71, while the recent high stands at $4,868.00. The current price of ETH/USDT is approximately $2,486.59, reflecting a positive change of +2.77%.
Current Market Sentiment and Technical Indicators
Ethereum is in a corrective phase within a larger bull market structure. Key support levels to monitor include $2,111.94, while resistance levels are noted at $4,868.00. Additionally, Fibonacci retracement levels provide further insight into potential price targets and reversal zones. The second chart, focusing on price action and technical indicators, supports this bullish outlook.
For instance, the RSI is currently at 40.74, indicating bearish territory but not yet oversold. The MACD line at 40.93 and the signal line at 177.11 show a negative histogram value of -136.18, suggesting bearish momentum.
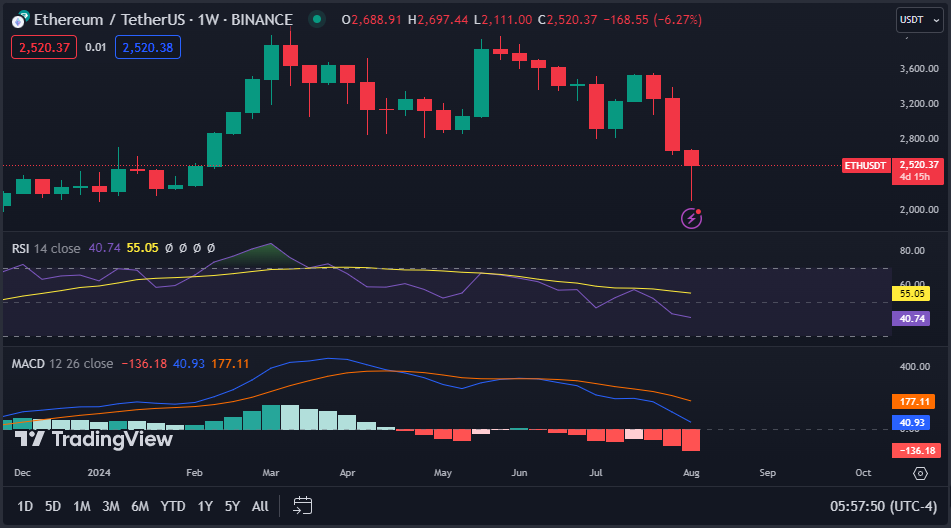
Source: TradingView
However, despite the bearish short-term indicators, the long-term outlook remains positive. The current price of ETH/USDT at $2,520.37 shows a weekly drop of 6.27%. Key support around $2,111.00 and resistance around $2,800.00 are critical levels to watch.
The RSI and MACD both indicate bearish momentum, with the RSI approaching oversold levels. As Ethereum is on its correction phase, the potential for a upward move remains, driven by the technical indicators and support/resistance levels.