

- Bitcoin tests an important resistance point around an $85,000 to $91,000 breakout level.
- According to the structure of the H&S pattern, a possible reversal may take place if Bitcoin breaks its downtrend.
- A clear breakout over the 200 DMA will signal the onset of an upward trend.
As of this moment, Bitcoin (BTC) is showing sharp price action, trying to clear the way toward key resistance levels in March 2025. The potential reversal formation in the one-hour chart with respect to bullish momentum is taking hold based on the Head and Shoulders (H&S) pattern. For now, Bitcoin is seen trading at $84,006.99. It has been moving into a channel defined by resistance at $85,000 while grappling with significant support near $82,000. Breaking this current downtrend could see Bitcoin shooting its targets near the range of $91,000 as it coincides with the support band towards the bull market.
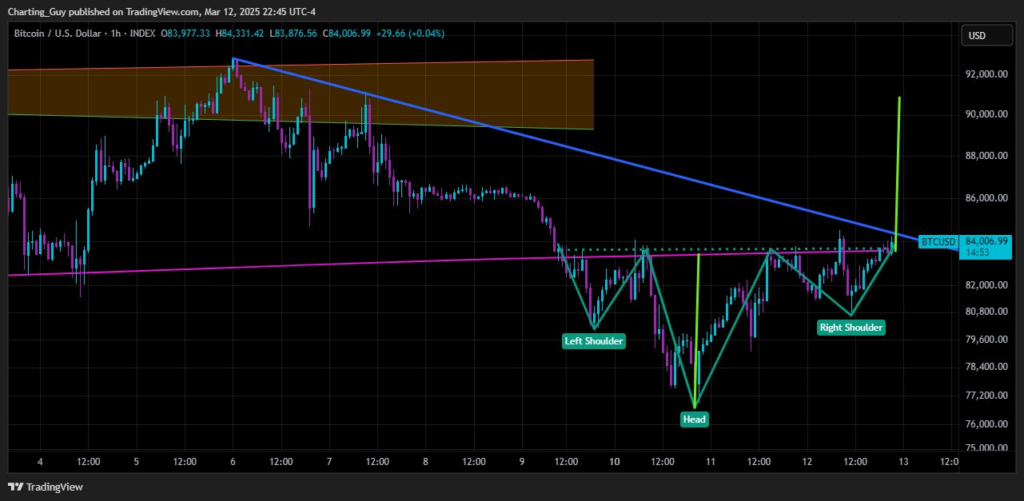
He adds that he is particularly interested in the actual formation of the H&S pattern. The chart marks Left Shoulder, Head, Right Shoulder- a reversal signal as seen in technical analysis, this was the Left Shoulder dragging around March 10, after which the price then dropped sharply to create the Head with the price now trying to form the Right Shoulder, indicating completion of this reversal pattern, and thus a possible breakout. The pattern is significant since it indicates that Bitcoin could be consolidating before a major move higher.
Main Resistance Area and Supportal
Other price actions that the chart suggests act critical levels of resistance and support. The downtrend from which Bitcoin has struggled for a break, the blue trendline, is the one that needs to be exceeded if the H&S pattern is to be formed. So, for set completion, closure must occur above the blue line in this case.
Presently, Bitcoin is testing the $84,000 mark, a level that has acted both resistance and support over the previous couple of days. A clear break above $85,000 would be the first sign that the price could start moving toward the target of $91,000. Traders carefully monitor this, as near the $91,000 level, the bull market support band can be well considered a decisive indicator of a healthy uptrend.
This is also critical to the analysis; that pink line at the 200-day moving average (DMA). It holds the longer-term trend and should be critical as a support or resistance for Bitcoin. The fact that Bitcoin is hovering so near that level indicates that it is kind of at a crossroads, with an above or below move determining new direction for the next major one. If Bitcoin can close above that pink line, it could indicate the beginning of a very strong bullish phase. However, if it can’t seem to break this level and comes back below the 200 DMA, it’s going to be back into more bearish views again.