
- Dogecoin fell 15% in March 2025 signaling a possible reversal.
- Past dips below the lower Bollinger Band led to strong recoveries.
- Traders expect Dogecoin to potentially surpass $0.1750 if the trend continues.
Dogecoin (DOGE) finds itself in a shooting stage of price formation, as indicated in the month-to-month chart of March 2025. Currently selling at $0.1713, Dogecoin has recorded a 15.24% decline. “Despite the erosion sounding a bit alarming, this was part of a general pattern in the larger markets that could bring with it potential future growth.” Here it is, with critical insights available in the chart analyzed through the Bollinger Bands, which trader or investor should be looking out for.

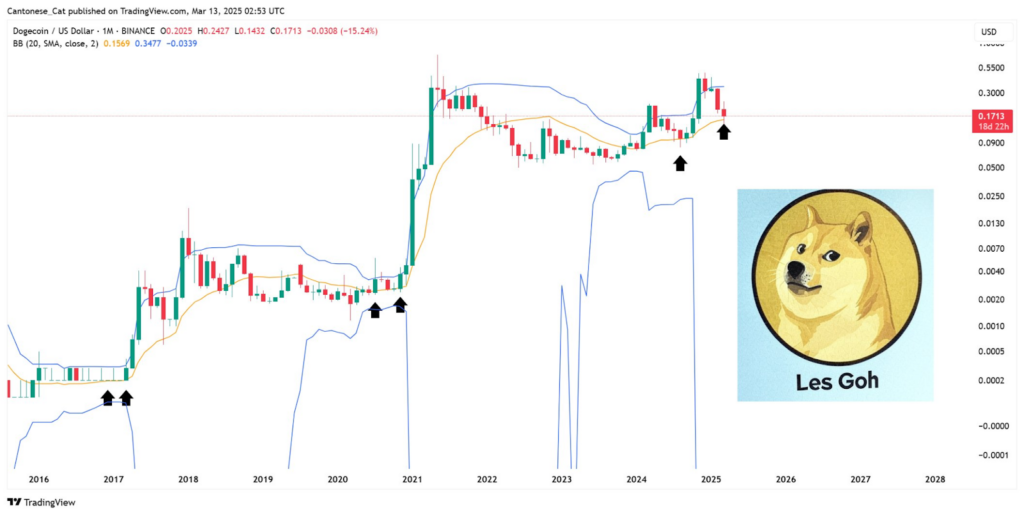
The Bollinger Bands help track market volatility. These bands create an upper and lower range that would indicate how the price of the coin moves. Hence, whenever the price of Dogecoin falls underneath the lower band, such as in early 2025, the price points to an oversold condition in the market. Historically, such points have been found to be the thresholds after which prices begin to reverse. After being below the lower band, the price has had a shooting star-like ascendancy over the years, especially in 2017 and even in 2021, when it recorded more than 1,200% factorization in terms of growth.
Functions of Bollinger Bands in market cycles
The price moving closer to or beyond the upper band typically indicates an overbought market, while the price approaches or falls below the lower band indicating that the market is oversold. The analysis on the chart demonstrated how movement of Dogecoin with respect to its price across time has usually followed the signals generated, implying cyclical nature. The abrupt movement from 2020 to 2021 proved the point when the price crossed over the upper band and the following upward price movement took offense to many others.
In early 2025, the price just fell under the lower Bollinger Band, and history has shown it to have a similar movement as to those before it. The price continues to be below that band, but historically that has proven to have the potential for a price change to follow it. Traders aware of such historical price patterns may expect a recovery to take place relatively soon, as happened in previous downturns just for prices along the similar trajectory. This recovery could once again lead to substantial movement and breach the previous $0.5 in line with previous cycles.