- Solana’s revenue plunged 93% from its January peak, mirroring declining trading volumes and waning investor interest.
- SOL’s price hit $260 in January but retraced to $121 by March, testing a key support level with potential for a rebound.
- Market volatility peaked in February with SOL reaching $12B in value before a steep decline, signaling shifting investor sentiment.
Solana (SOL) revenues have also dropped by 93% from a January high, according to data by DefiLlama. Recent price action shows volatile volumes of transactions and price swings, indicative of indecisive investor behavior.

Market Dynamics from September to March
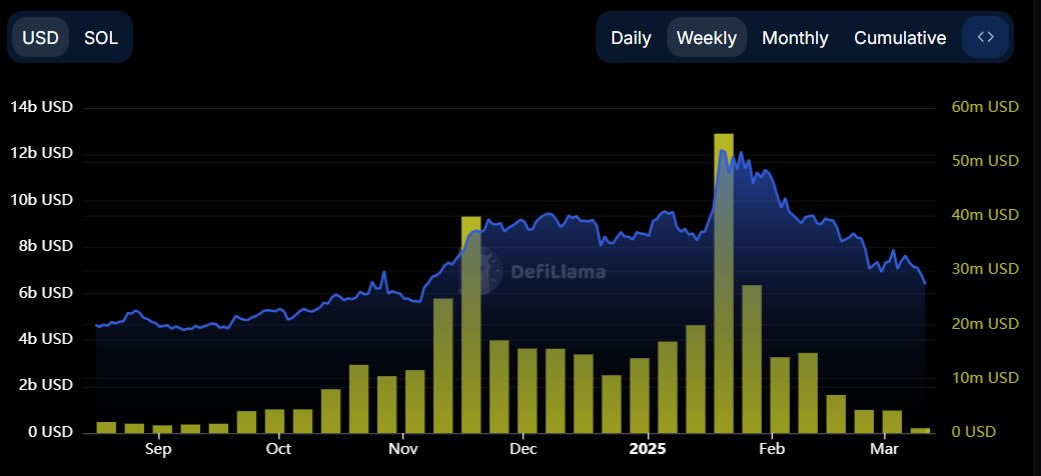
During the months of September and October, the market capitalization of Solana fluctuated regularly between 4 and 5 billion USD. Volumes in these months were minimal and illustrated minimal fluctuations. However, as October went on, there was a regular increase, with market capitalization creeping up, even though activity was modest.
By November, bullish momentum strengthened. The market value surged past 6 billion USD, accompanied by notable trading volume spikes. December continued this upward trajectory, with values surpassing 8 billion USD. Trading volumes mirrored this growth, indicating heightened investor interest.
In early 2025, the market stabilized at 8 to 9 billion USD. However, trading volumes became more erratic. February saw a dramatic surge, with market value peaking at nearly 12 billion USD. This was the highest value recorded in the period. Trading volumes also hit their peak, exceeding 50 million USD.
Following the February peak, a steady decline began. By March, the market value dipped closer to 6 billion USD, while trading volumes dropped significantly. This decrease reflects reduced market activity and declining investor enthusiasm.
Price Movements and Future Projections
Solana’s price trend from July 2024 to March 2025 displayed multiple shifts. In July, SOL prices fluctuated within the $110 to $120 range, marking the lower boundary of the demand zone. This stability extended into September.
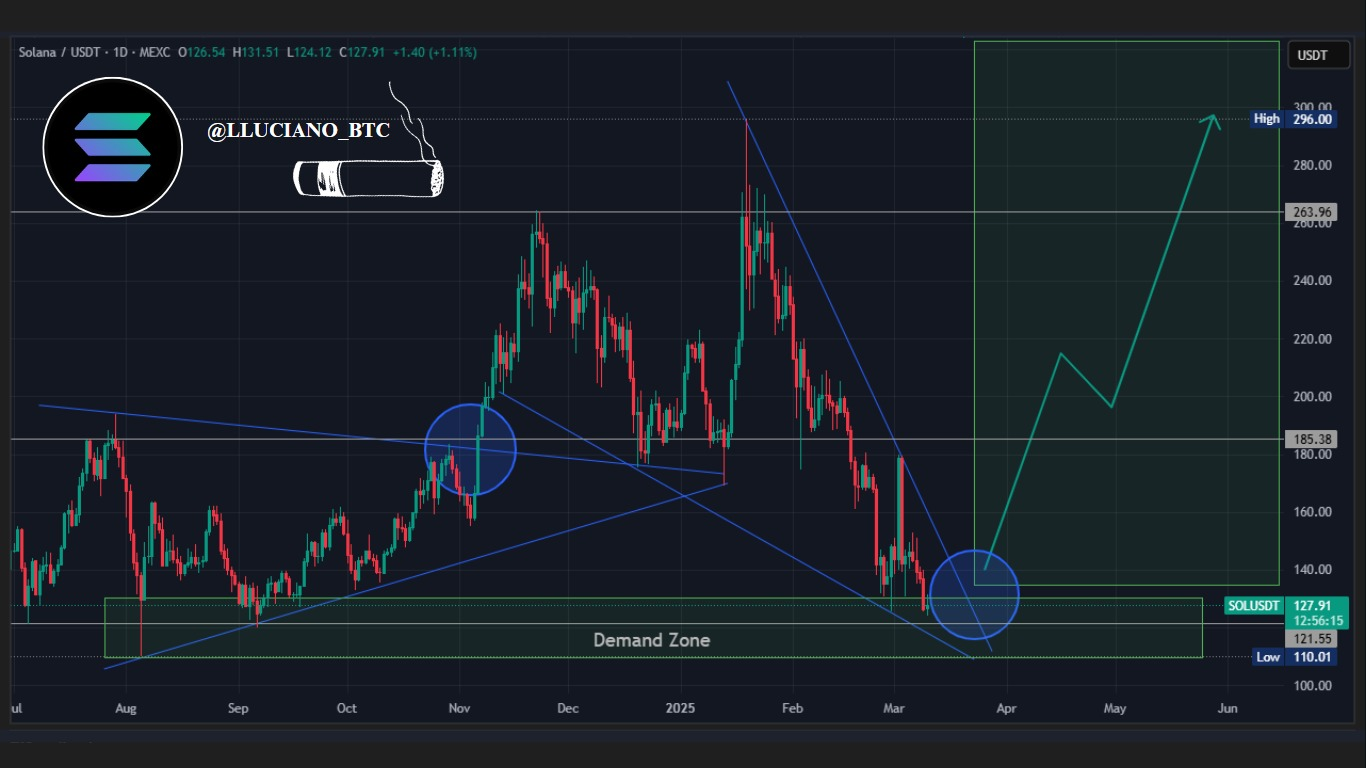
In October, the price broke above a descending trendline, surpassing $140 and indicating bullish momentum. November saw SOL reaching $185 before experiencing a brief pullback. The breakout zone, marked by a blue circle, established key support. The price held strong through December, peaking near $260 in January 2025.
However, a strong downward trend followed. By March, SOL retraced to the critical support zone around $121.55. This level represents a significant pivot point. Projections suggest a possible recovery, with an initial target of $185.38. Further gains could push prices to $263.96, with a longer-term goal of $296.00.