

- PEPE’s price hits a crucial support level, drawing attention from traders expecting a potential breakout.
- Market activity suggests accumulation as technical indicators show a rounded bottom, hinting at a possible uptrend.
- Fibonacci retracement levels indicate a 40X price movement could emerge if momentum builds.
The price of PEPE has reached a critical low, drawing attention from traders and analysts. Market data indicates that the token is at its bottom, with increasing speculation about a significant price movement ahead. Observers note that $PEPE could experience a substantial 40X surge if momentum builds.
PEPE at a Key Market Low
PEPE’s price has remained at a low level, sparking discussions across crypto trading platforms. The asset’s movement aligns with broader market conditions, where several tokens have experienced fluctuations. Current trading volumes suggest that accumulation is occurring, with traders closely watching for any potential breakout.
Technical indicators point to a stabilization phase, with analysts monitoring key support levels. Historically, similar patterns have led to notable upswings in crypto markets. While PEPE remains at its lowest observed price range, traders are assessing potential catalysts for movement.
Market Speculation on a 40X Surge
Discussions within the crypto community focus on the possibility of a significant price increase. Observers indicate that PEPE’s current position aligns with patterns seen before sharp rallies. Increased trading volume and market liquidity could influence any future price movements.
According to the analysis prepared by Crypto Elites, Fibonacci retracement levels indicate price corrections, with support near the 61.8% level before a breakout. The observation outlines a rounded bottom formation, signaling a potential upward movement.
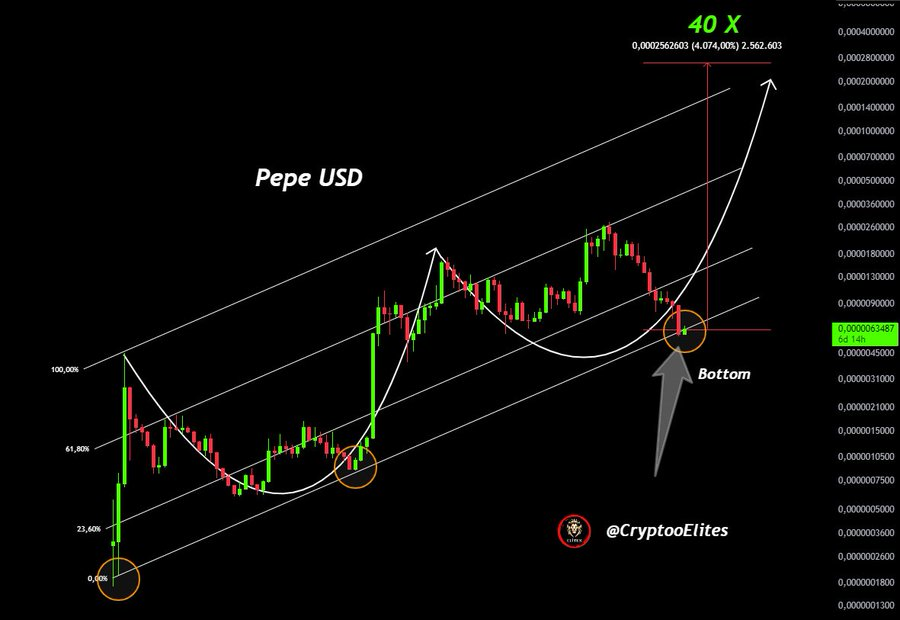
The marked bottom area suggests a key level where the price was previously reversed. Trend lines define a parallel channel, with the price oscillating between resistance and support. The projection shows a 40x move based on historical patterns. The price is near a lower support level, aligning with past reversal points within the structured trend channel.