
- A bearish head and shoulders pattern is confirmed by SUI, which breaks below the $2.90 neckline and aims for $1.70.
- A negative trend approaching the $1.70 support level is strengthened as the market structure moves to lower highs and lows.
- Failed recovery attempts and strong selling pressure suggest further downside unless the price reclaims key levels.
Ali_charts indicated a negative trend by highlighting a price change in SUI/USDT. The price has confirmed a head and shoulders pattern by breaking below a crucial neckline at $2.90. As a result, the price has decreased and is now selling at $2.42.

Head and Shoulders Formation Confirms Bearish Momentum
The formation of the head and shoulders pattern is a textbook bearish signal. The left shoulder peaked in mid-December, followed by a higher peak forming the head in January. In February, the right shoulder developed, showing a lower high. This structure indicated a possible shift in market sentiment.
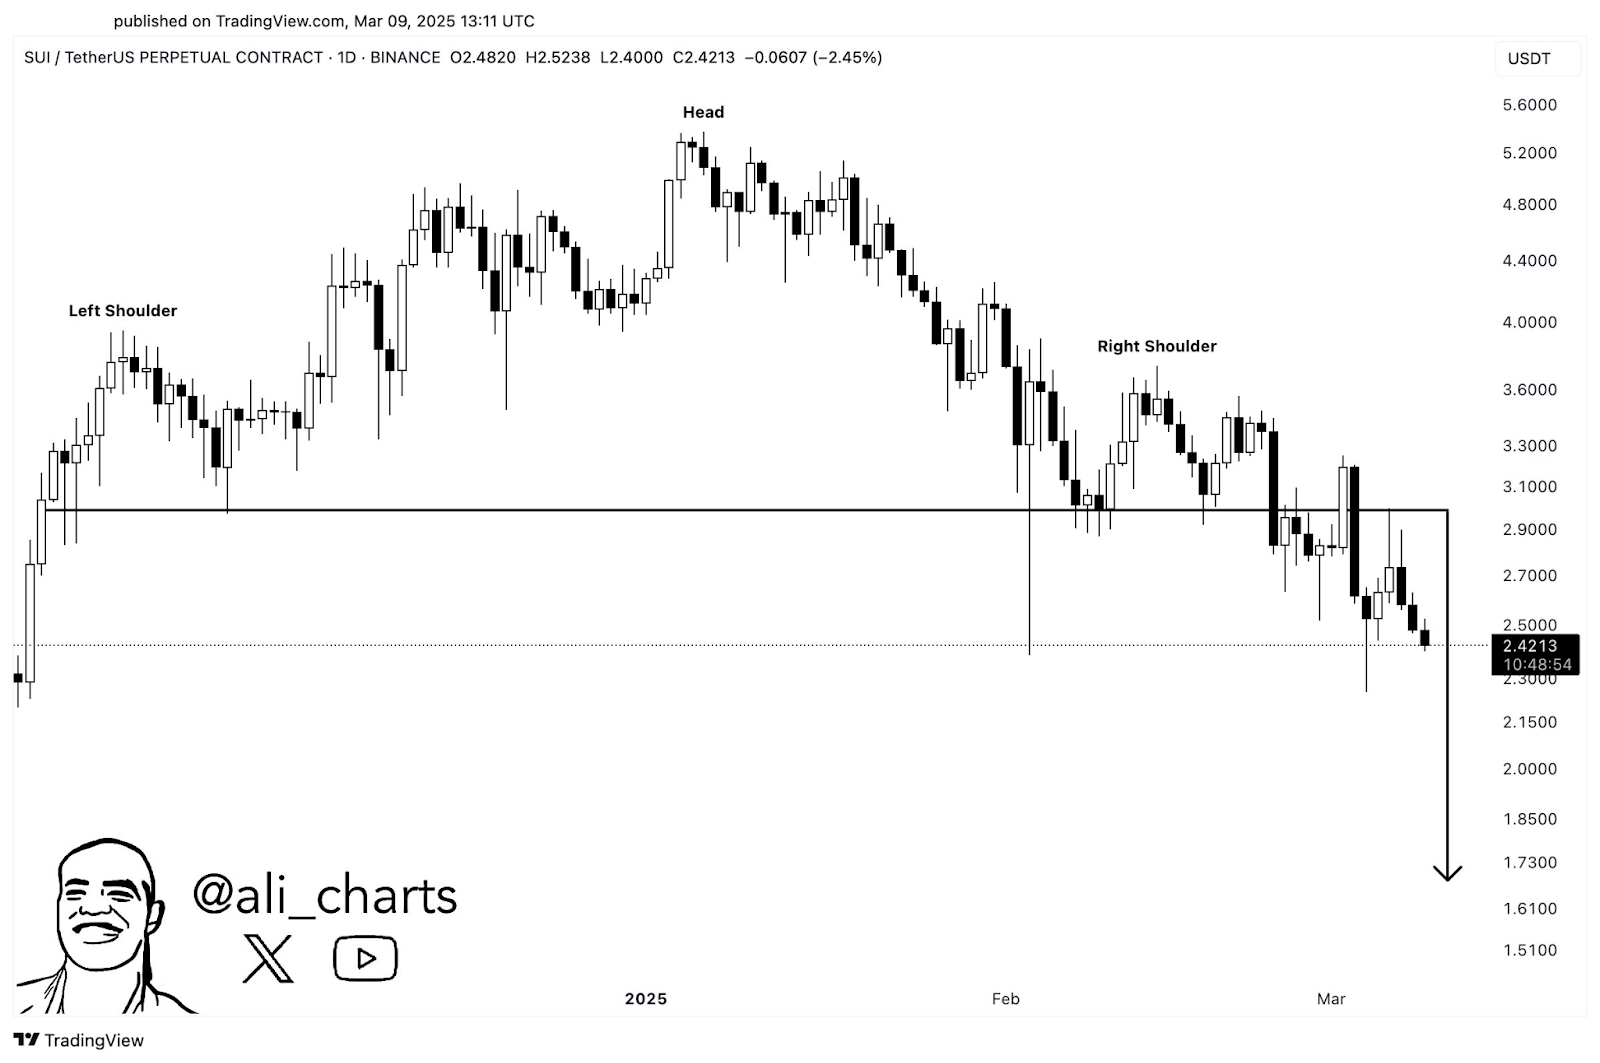
The neckline, a crucial support level, formed around $2.90. The price fell more quickly after breaking below it. This breakdown indicated a change from an upward to a downward trend, which also validated the pattern. Besides, failed attempts to reclaim the neckline reinforced the bearish outlook.
Volume and Market Structure Support Bearish Outlook
The market structure has transitioned from higher highs and higher lows to lower highs and lower lows. Moreover, post-breakout candlestick patterns show strong bearish momentum, with sellers dominating price action.
Additionally, the support zone near $2.30 briefly halted the decline. However, the price failed to gain bullish momentum and continued downward. The projected target of $1.70 aligns with the height of the head subtracted from the neckline level. This method is widely used in technical analysis to determine price targets.
Key Takeaways for Traders
Traders focusing on technical analysis recognize this setup as a strong bearish signal. A sustained drop below $2.30 could open doors for further downside. Moreover, increased selling pressure suggests that any recovery attempt might face resistance near previous support levels.
Hence, the SUI price action suggests that traders should approach cautiously. A confirmed bearish breakout increases the likelihood of the price reaching $1.70. Additionally, volume confirmation remains essential for further validation.