
- Solana rebounded from $118, showing early signs of recovery. A break above $142.50 and $158 could confirm a bullish shift.
- The TD Sequential “9” suggests selling pressure may be fading, signaling a possible price reversal if key resistance levels break.
- Buyers are active near $130–$140, pushing SOL toward $180. If support fails, the price could drop further.
Solana (SOL) is showing early signs of recovery after weeks of selling pressure. The cryptocurrency recently dropped to $118 before bouncing back, with analysts watching key resistance and support levels.
TD Sequential Indicator Signals a Buy Zone
Ali Charts analyzed Solana’s price action against the U.S. Dollar on a 4-day timespan. The trend has remained bearish, with consistent selling pressure. The latest candlestick closed at $137.62, marking a 5.91% decline.
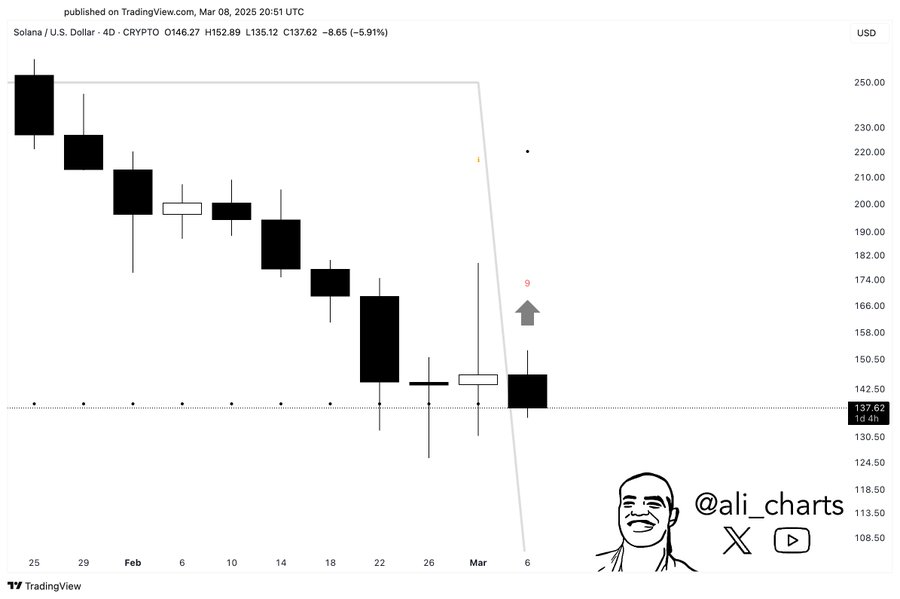
Tracking the market movements, the downtrend started in early February, with lower highs and lower lows. The sharpest drop occurred around February 22, followed by a short consolidation phase. Recent price movements show long lower wicks, indicating buyers stepping in at lower levels.
A TD Sequential indicator flashed a red “9” above the latest candlestick, often a sign of trend exhaustion. A downward trendline connects past highs, reinforcing the bearish structure. For a breakout, SOL needs to move past resistance at $142.50 and $158.
Potential Rebound Toward Key Resistance Levels
According to Panzuki.eth’s analysis, Solana’s price action against Tether (USDT) on the daily time frame reveals key trends. The latest candlestick closed at $137.36, reflecting a 3.38% increase. Resistance levels to watch are $140, $180, $210, and $262.
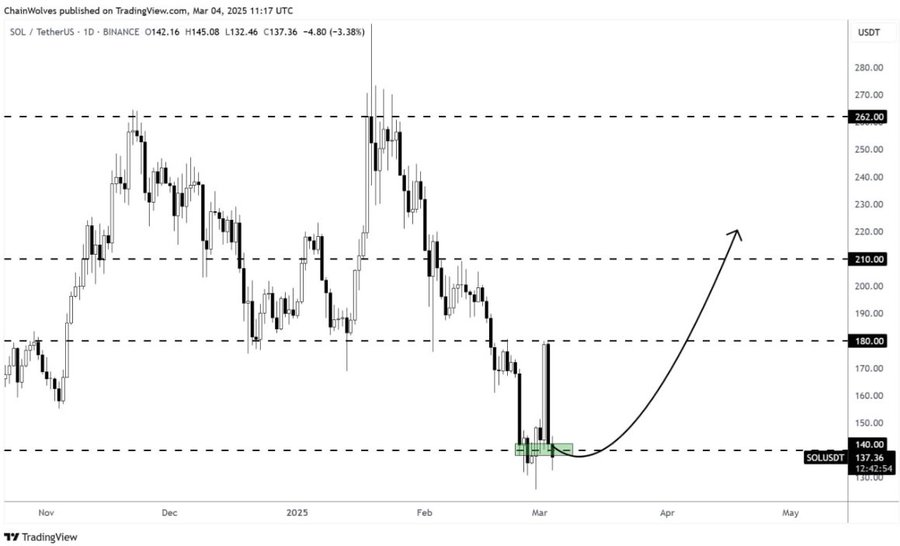
The price trended downward from February into early March, reaching a low of $118 before bouncing. A green support zone between $130–$140 suggests strong buying interest. A curved arrow on the time frame hints at a possible move toward $180.
He noted that the large candlestick wicks near support indicate buyers defending the price. A break above $140 could build momentum toward higher levels. If support at $130 fails, further losses could follow.