
- Ethereum whale offloads 40K ETH, stirring market reactions amid price speculation and investor sentiment shifts.
- ETH price closely tracks active addresses, signaling adoption trends and potential market moves based on user activity.
- Bullish signals emerge as RSI diverges, with Ethereum eyeing $3K, while $2K remains a crucial support level.
In the last two days, an Ethereum whale sold 40,000 ETH for $89.2 million over the counter, according to Wu Blockchain. 114,500 ETH, or $358.19 million, were previously given to this business from Genesis Trading’s August liquidation last year. As a result, the cryptocurrency market has been quite interested in this big deal, which has led to concerns about possible price changes and investor attitude.

Ethereum Price and Active Addresses Show Strong Correlation
The price history of Ethereum demonstrates very strong correlation with active addresses. Ethereum surpassed $1,200 strongly from 2016 to early 2018 with a very steep rise in active addresses over 600,000. It declined sharply along with the overall market correction. From 2018-2019, the price of Ethereum plummeted strongly with active addresses dropping to 200,000-300,000.
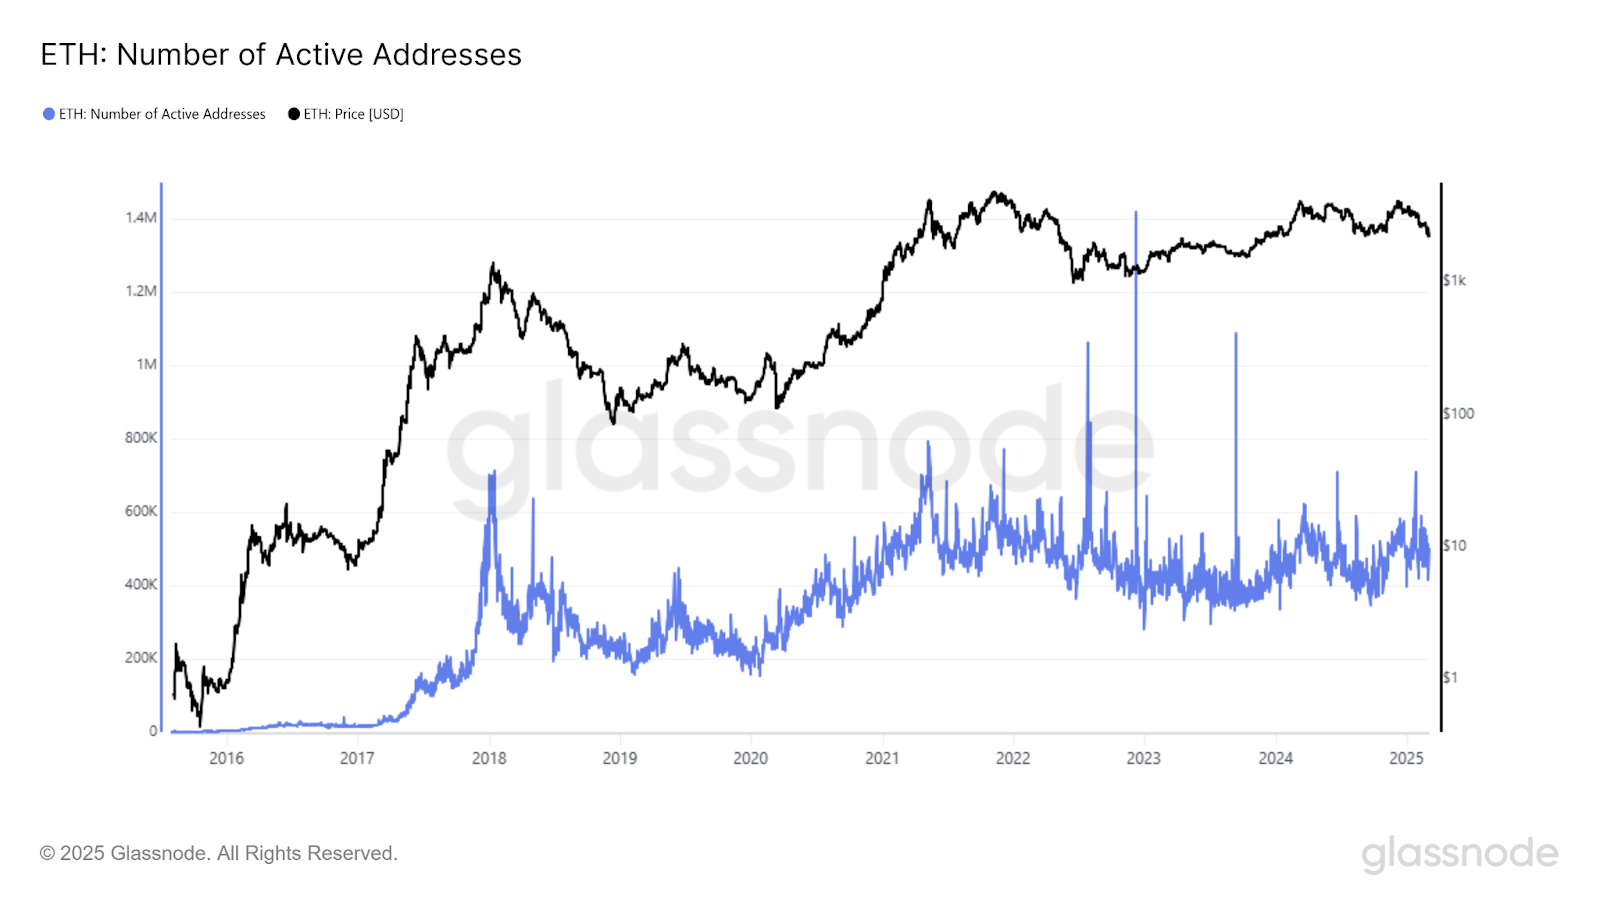
In 2020, Ethereum’s bullish trend resumed, surpassing previous all-time highs in 2021. Active addresses climbed to nearly 1 million, signaling increased adoption. Market volatility persisted, with both price and network activity experiencing fluctuations. The period from 2022 to 2023 saw Ethereum maintaining higher price ranges compared to pre-2021 levels. Active addresses trended upwards, with spikes during key market events, suggesting increased transaction volume and engagement.
Ethereum’s Market Structure Shows Bullish Strength
Ethereum’s 4-hour chart on Binance shows a large market reversal. Price initially registered lower lows, indicating a downtrend. However, a bullish divergence was created since the Relative Strength Index (RSI) was making higher lows. The formation suggested less bearish momentum before Ethereum bounced hard.
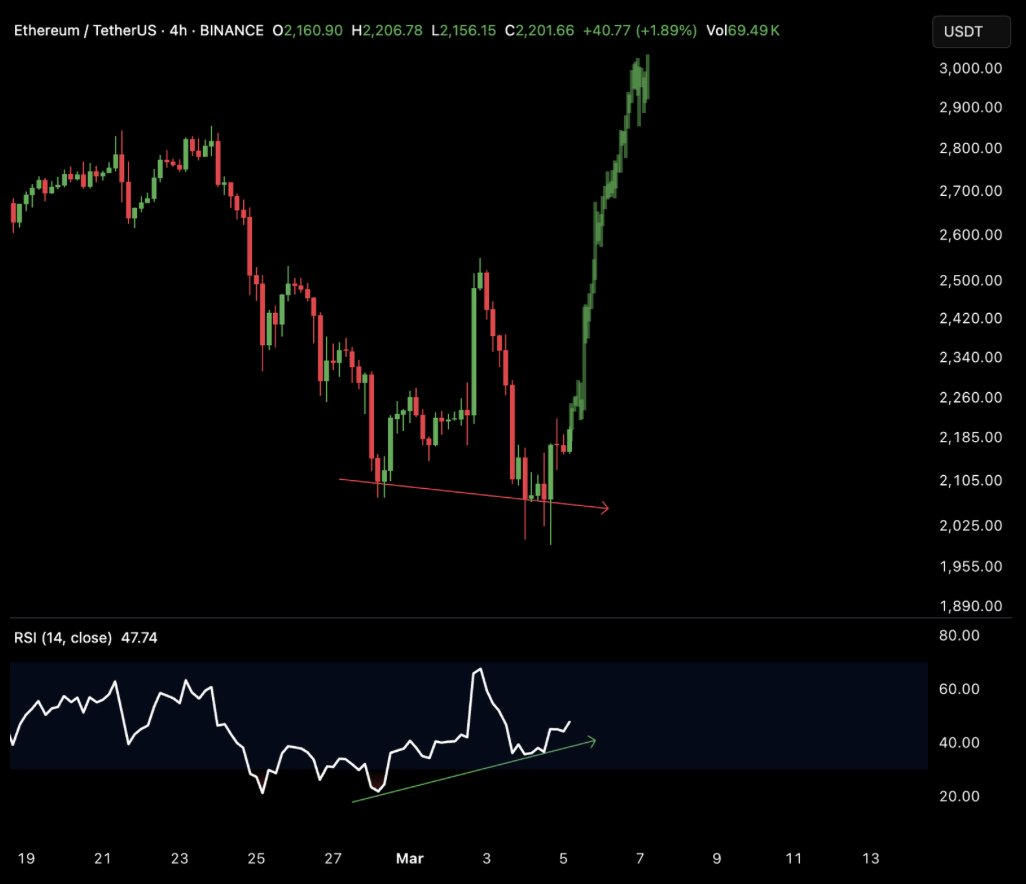
Price burst through a number of resistance levels, exceeding $2,200. Increased trading volume testified to intense buying pressure. The RSI, while in oversold conditions, increased, mirroring increasing demand. Ethereum price shifted towards the $3,000 level prior to some consolidation.
Despite the pullback, RSI levels are still far from extreme overbought levels, indicating room to move upwards. The $2,000 support level played a critical role before Ethereum’s breakout. A retest of this zone could determine future market direction.