
- Bitcoin’s MA50 weekly and MA200 daily create a strong support zone, crucial for maintaining bullish momentum.
- A break below $72K–$76K could lead to further downside, while holding this range may reinforce long-term growth.
- Increased volatility signals uncertainty, but strong buying near key levels suggests accumulation by larger investors.
Bitcoin is on its way towards critical support areas, according to crypto analyst Doctor Profit. In the bull phase since March 2023, Bitcoin has never crossed below the MA50 weekly. That is why it’s such a solid support level and key sign of strength in a bullish trend.
If Bitcoin again reaches this area, Doctor Profit is willing to open a huge long position. But the MA200 daily is still such a strong resistance. So long as this level is sustained, Bitcoin can stick with its present trend. The market remains bullish in spite of the correction, and investors need not worry.
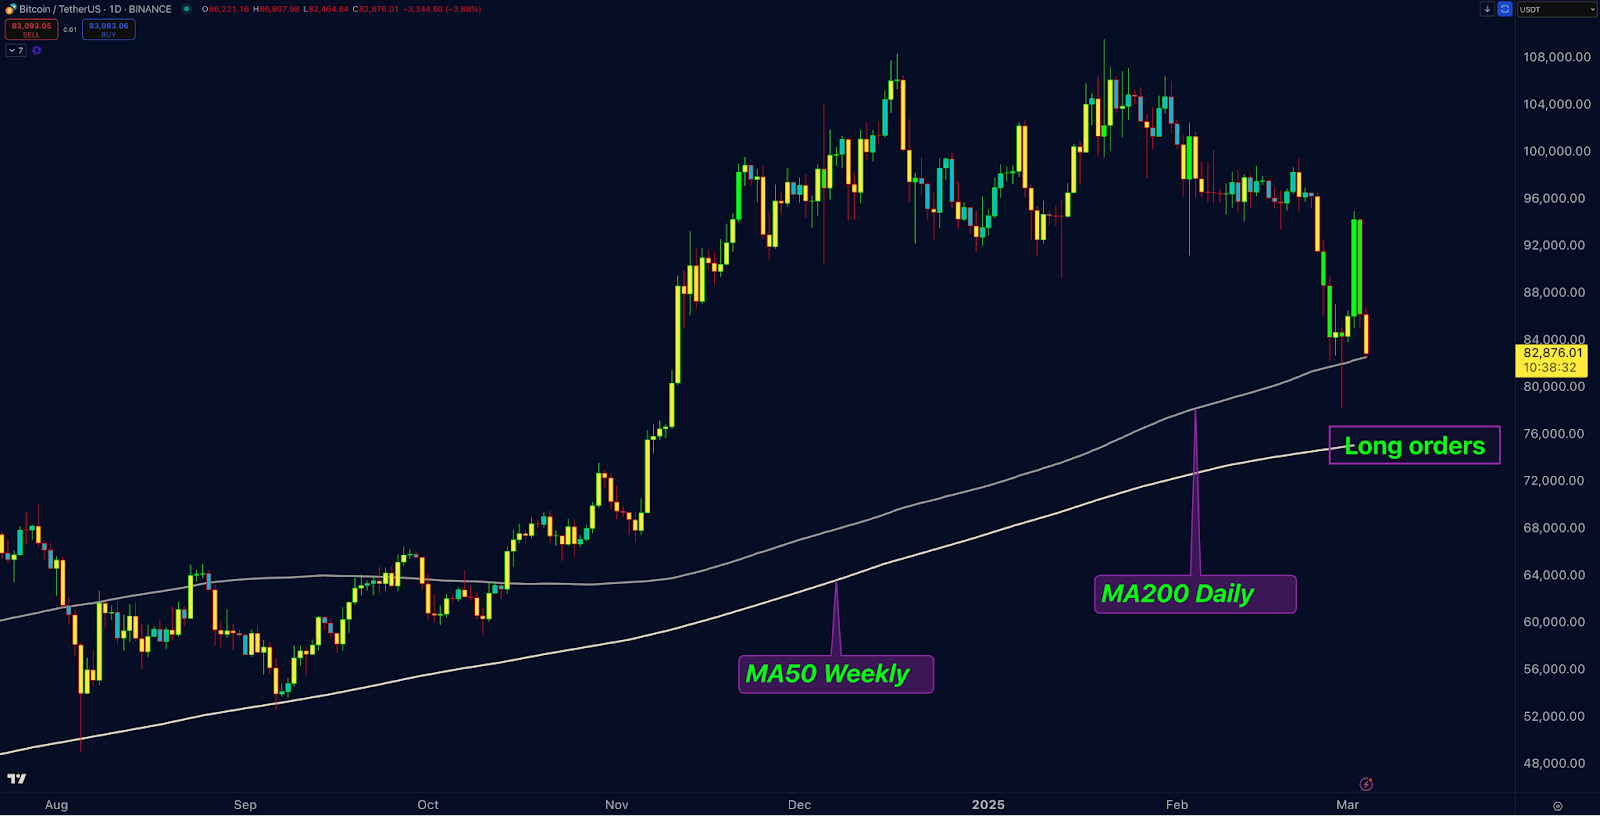
Bitcoin Tests Key Moving Averages
Bitcoin recently declined sharply from over $100,000 to approximately $82,876.01. The strong downtrend was followed by a brief recovery and another pullback. However, the MA200 daily provided significant support, leading to an immediate bounce. This reaction suggests that buyers are stepping in at these levels.
The meeting of the MA50 weekly and the MA200 daily creates a key support point between $72,000 and $76,000. Breaking through this point can cause more losses, while defending it can enhance the bull trend. The buyers must maintain these levels in order to support long-term development. The market remains indecisive, with increasing volatility impacting price action.
Potential Scenarios for Bitcoin’s Next Move
Bitcoin’s recent price action indicates possible consolidation near key moving averages. Holding above the MA200 daily could signify strength, increasing the chances of an upward move. However, failure to hold may result in further losses. Resistance remains strong at $90,000, where selling pressure intensified. The previous all-time high above $100,000 is a major hurdle for bullish continuation.
A key observation is the liquidity hunt below the MA200 daily. The price briefly dipped before rebounding, signaling accumulation by larger market participants. Additionally, the green recovery candle following a strong bearish move highlights aggressive buying interest.