

- Bitcoin’s price has followed a five-wave pattern which now nears completion.
- Market cycles suggest a possible retracement phase may soon begin.
- Historical trends show Bitcoin may stabilize before the next major move.
Bitcoin’s latest price action follows an almost textbook example of Elliott Wave Theory, with the market respecting the five-wave impulse pattern while maintaining its trajectory within a well-defined ascending channel. The current price of Bitcoin, standing at $84,641, highlights a market that has surged through each wave with striking consistency, adhering closely to harmonic market cycles.
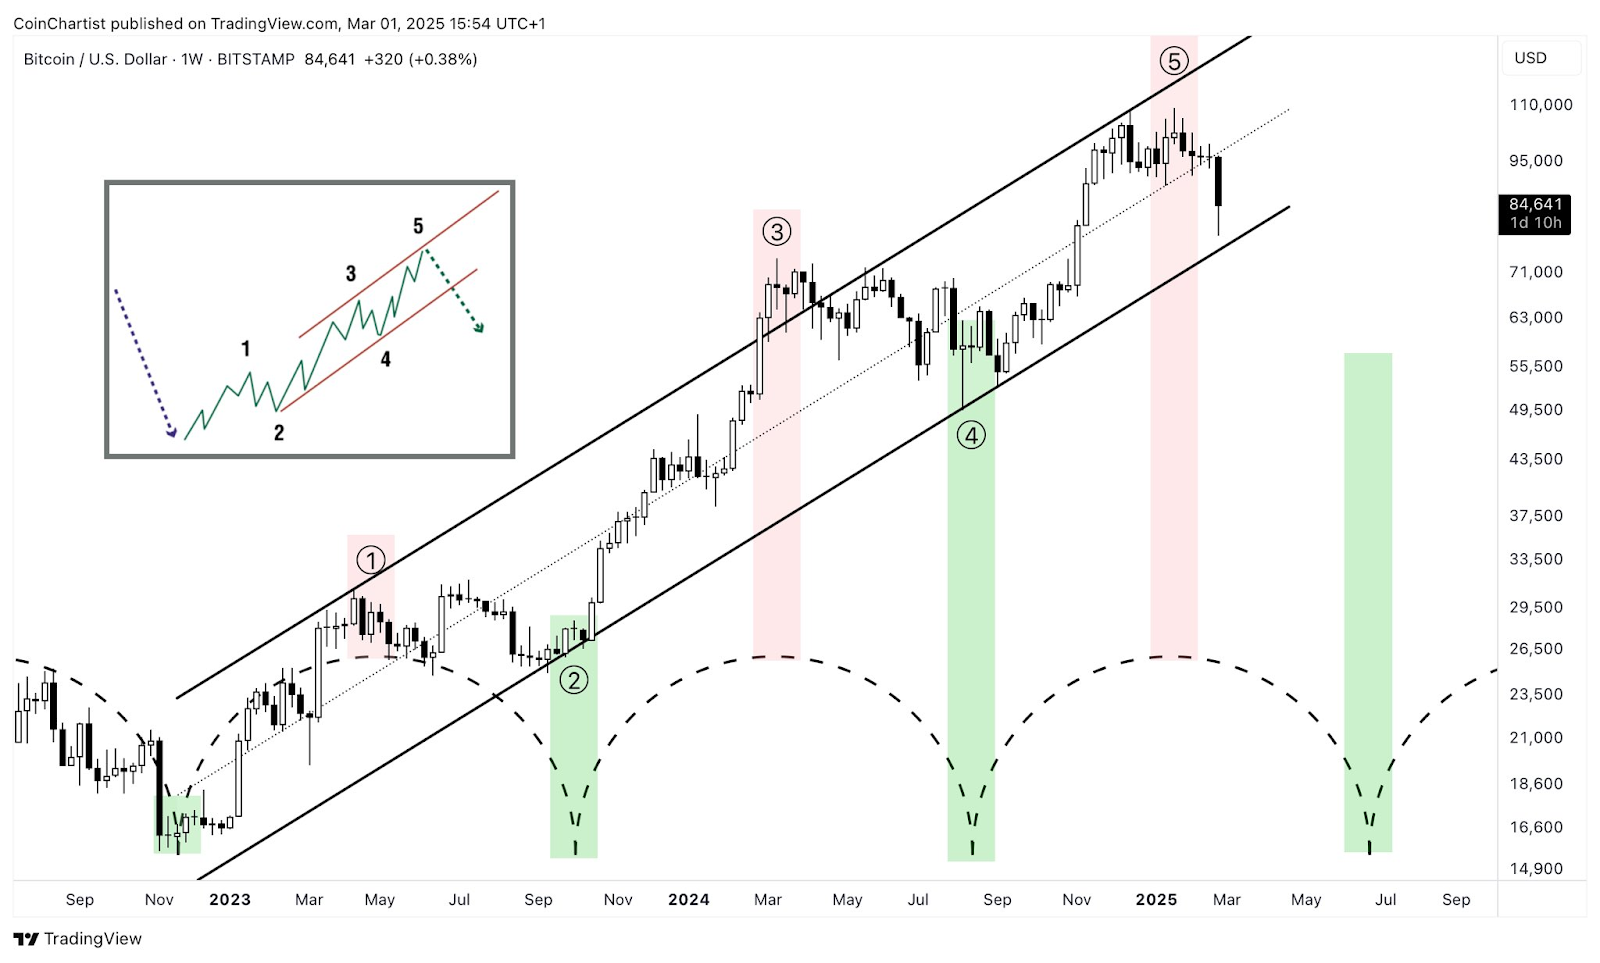
A detailed examination of the chart reveals that Bitcoin has completed the five-wave cycle, peaking in what appears to be the terminal fifth wave, which aligns with historical cyclical patterns that have often led to corrections. The timing of these waves also aligns with key economic and political events, notably correlating with the inauguration of former U.S. President Donald Trump, adding another layer of intrigue to the macroeconomic forces driving Bitcoin’s price.
Wave Equality and Channel Adherence Confirm Market Discipline
The Elliott Wave count on the chart shows a strong adherence to the theory’s core principles, with waves one and five demonstrating near-equal length, suggesting a guideline of equality is at play. The third wave, often the most explosive in an impulse sequence, exhibits a throw-over beyond the upper trendline, confirming the strength of the uptrend before eventually stabilizing within the primary channel.
Additionally, the chart incorporates cyclical troughs and crests, with green and red highlight zones marking Bitcoin’s key corrective phases. Each major correction aligns with a support level within the channel, maintaining Bitcoin’s bullish structure while confirming that market cycles remain a dominant force in price movements. With Bitcoin retracing from the top of wave five, it signals that a possible corrective phase, corresponding to an ABC correction, could be imminent, echoing past cycles.
Harmonic Cycles Indicate Potential Price Reaccumulation
The presence of harmonic cyclical movements in the chart suggests that Bitcoin’s bullish structure remains intact despite local corrections, with green zones marking previous consolidation phases before the next impulse move. The key support levels on the chart indicate that if Bitcoin follows historical price behavior, any retracement may find stability around the lower boundary of the ascending channel, reinforcing the argument that the broader trend remains bullish.
If the pattern holds, Bitcoin’s price action may enter a cooling-off period, allowing for reaccumulation before another macro-level move. While some alternative bullish counts remain on the table, the precision of the Elliott Wave structure suggests that traders and analysts should not ignore the possibility of a structured retracement phase before any renewed push higher.
Political and Macro Factors Influence Bitcoin’s Timing Cycles
The correlation between Bitcoin’s cyclical behavior and external macro events is another factor worth considering. The chart’s reference to Trump’s inauguration aligning with these wave structures introduces a potential intersection between financial markets and political events, implying that broader geopolitical influences may contribute to Bitcoin’s timing cycles.
With market sentiment still reflecting high levels of enthusiasm, the completion of this structured five-wave sequence raises questions about whether Bitcoin will follow historical tendencies and enter a corrective phase or whether external market forces will override traditional charting methods. Regardless of the scenario that unfolds, the adherence to Elliott Wave principles within this Bitcoin price chart highlights how historical market behavior continues to offer valuable insights into future price action.