

- XRP’s Wave (5) could push prices to $20–$66, aligning with Fibonacci levels and previous bullish patterns.
- Elliott Wave analysis shows XRP in a strong trend, with potential resistance and support shaping market action.
- Market cycles show XRP’s bullish waves rise slowly, and bearish drops are sharp, highlighting the importance of significant resistance levels.
XRP is showing strong bullish momentum as market trends indicate a potential breakout. Elliott Wave analysis suggests a five-wave impulse move, positioning XRP for significant price movements.
Elliott Wave Count and Fibonacci Projections
Market analyst EGRAG CRYPTO the Elliott Wave pattern indicates an upward trajectory, with each wave building upon the previous one. Wave (1) initiated the uptrend, breaking out from a prolonged consolidation phase. Wave (2) experienced a sharp retracement, conforming to historical correction patterns. Wave (3) exhibited strong bullish pressure, extending to 161.8% of Wave (1), aligning with typical Elliott Wave extensions.
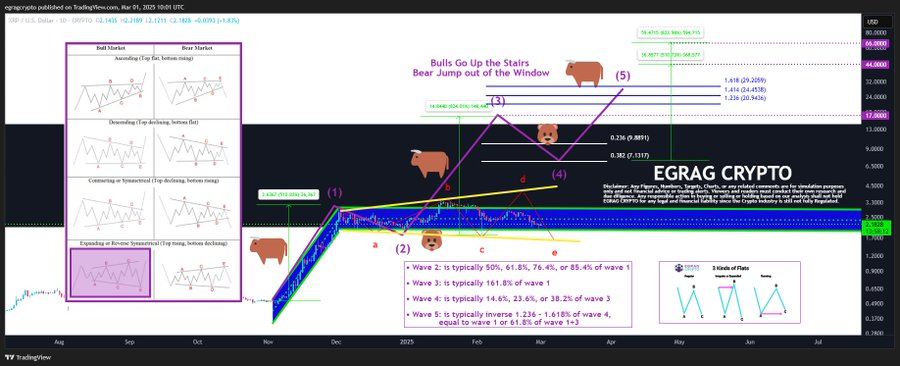
Wave (4) followed with a corrective pullback, adhering to Fibonacci retracement zones. Current projections indicate that Wave (5) could extend between 1.236 and 1.618 Fibonacci levels, positioning XRP within a potential price range of $20 to $66. The analysis further outlines market trends based on Fibonacci calculations. The inverse 1.236 – 1.618 extension of Wave (4) places XRP between $20 and $29.
An equal projection to Wave (1), which recorded a 510% increase, estimates a price target of $44. Combining 61.8% of Wave (1) and Wave (3), the analysis calculates an upper price target of $66. The market’s response to these projections will be crucial in determining future trends. These Fibonacci-based targets provide potential resistance and support levels for XRP.
Market Trends and Technical Indicators
The market structure highlights distinct bullish and bearish phases. The bullish market phase is characterized by price acceleration, while the bearish phase typically results in sharp declines. Expanding and symmetrical triangles further depict breakout possibilities, indicating price volatility. The time frame also includes three flat correction types, offering insights into potential market reversals.
EGRAG CRYPTO’s analysis emphasizes that bullish trends develop gradually, whereas bearish movements are often sudden and sharp. The phrase “Bulls go up the stairs, bears jump out of the window” illustrates this trend. The presence of strong Fibonacci resistance levels will be crucial in determining price action. The technical indicators suggest an extended bullish cycle if momentum continues to align with Elliott Wave projections.