

- Bitcoin follows structured halving cycles, with price peaks, corrections, and consolidation occurring at consistent intervals.
- Market analysts identify 831-day halving cycles influencing Bitcoin’s long-term price trends and investor activity.
- Buy and sell signals align with historical trends, showing predictable Bitcoin price movements after each halving event.
Bitcoin’s price volatility has previously been guided by disciplined cycles fueled by halving cycles and market forces. There are recurring patterns that analysts have recognized that influence Bitcoin’s long-term price trajectory, conditioning its market behavior
Halving Events and Long-Term Price Action
Bitcoin halvings occur approximately every 831 days, reducing miner rewards and impacting supply. Market analyst Master Kenobi examined Bitcoin’s movements between 2021 and 2025, comparing them to prior cycles. The analysis identified recurring price peaks followed by corrections and consolidation phases. Data indicates that Bitcoin follows an 831-day cycle between halvings, affecting price movements. Additionally, short-term cycles of 317 and 316 days impact local price trends. These patterns demonstrate Bitcoin’s structured response to supply adjustments and investor activity.
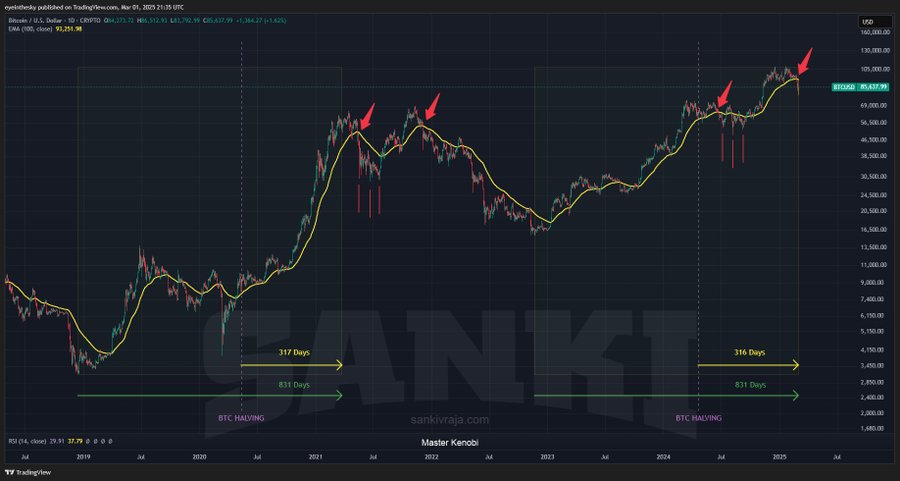
Bitcoin halvings occur approximately every 831 days, reducing miner rewards and impacting supply. Master Kenobi’s analysis revealed that each halving precedes a price surge followed by corrections. The time frame shows a yellow exponential moving average (EMA) line, tracking long-term price movements. Red markers indicate resistance levels where Bitcoin previously peaked before experiencing retracements. Despite short-term corrections, historical data confirms Bitcoin’s long-term price growth.
The pattern remains consistent across cycles, with price consolidation after peaks. Bitcoin’s price stabilizes along the EMA line before entering the next growth phase. This cycle has repeated throughout Bitcoin’s history, reinforcing a structured market trend. At the most recent data point, Bitcoin is near another potential peak.
Technical Signals and Market Behavior
Crypto analyst Cryptollica examined Bitcoin’s buy and sell signals over multiple halving cycles. The data shows that green buy signals appear at the start of bullish trends, while red sell signals emerge near peaks. Each cycle follows a predictable structure, with price increases after halvings and subsequent corrections.
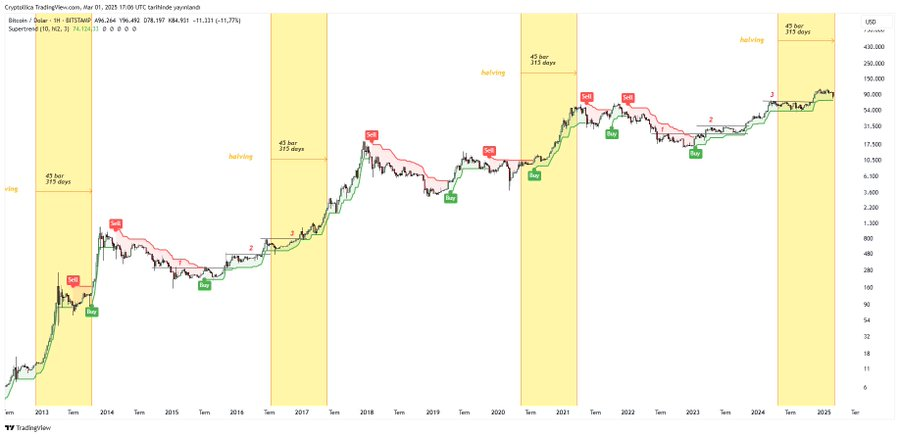
Bitcoin’s most recent halving event aligns with previous cycles, indicating a potential bullish phase. Moving averages suggest continued market strength, provided key support levels hold. Each halving cycle has historically triggered price shifts, shaping Bitcoin’s long-term trajectory. Market data analysis confirms that Bitcoin follows a structured pattern of accumulation, breakout, and retracement.