
- Bitcoin’s breakout from a descending channel signals a bullish reversal, with key support at Fibonacci levels.
- The Gaussian Channel flipping green hints at a parabolic rally, with BTC potentially targeting $190K before correction.
- Holding above key Fibonacci levels strengthens bullish momentum, with consolidation likely before the next leg up.
According to Crypto-ROD, Bitcoin’s price action suggests a potential trend reversal following a breakout from a descending channel. Recent price movements indicate a shift in sentiment, as BTC holds steady at $84,553.48. The market previously experienced a decline, forming a three-drive pattern before a notable impulse move. The current price action suggests a corrective phase, possibly forming a higher low before another leg upward.
Key Fibonacci Levels and Market Support
A Fibonacci retracement applied to the recent upward move highlights critical support zones. The 0.382 level stands at $83,407.75, the 0.5 level at $82,423.43, and the 0.618 level at $81,439.10. Besides, historical patterns show that retracement levels often attract buying pressure, strengthening bullish prospects.
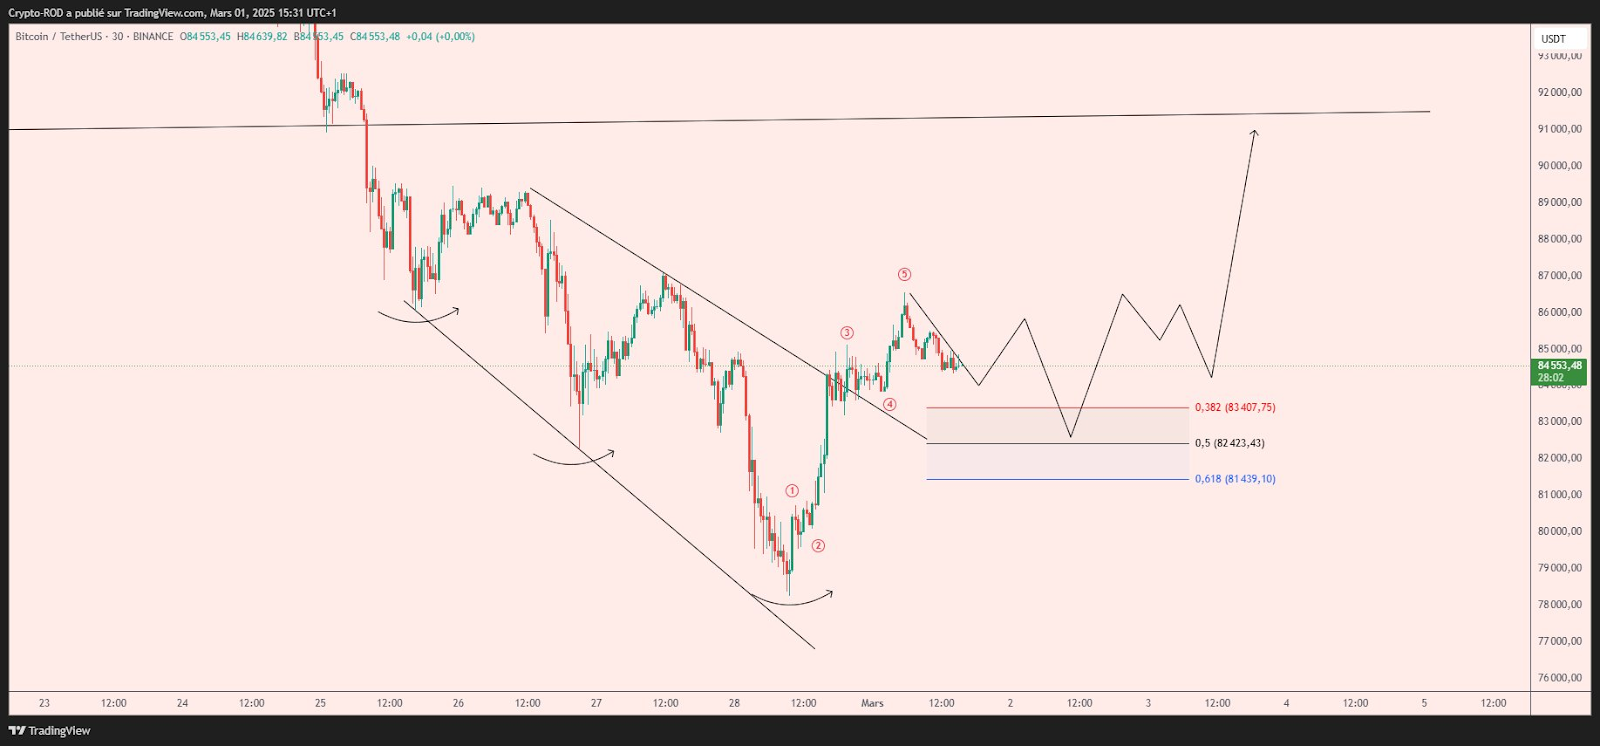
Furthermore, a previous descending trendline, now broken, indicates a shift in structure. The breakout from this trend suggests the potential for continued bullish movement. Market analysts project a consolidation phase before a decisive upward push toward the next resistance zone.
Long-Term Market Structure and Resistance Targets
On a macro level, the Gaussian Channel recently flipped green, signaling a historically bullish indicator. Every prior occurrence of this trend shift has resulted in parabolic BTC rallies. Current projections estimate a cycle top exceeding $200,000, aligning with past bullish patterns.
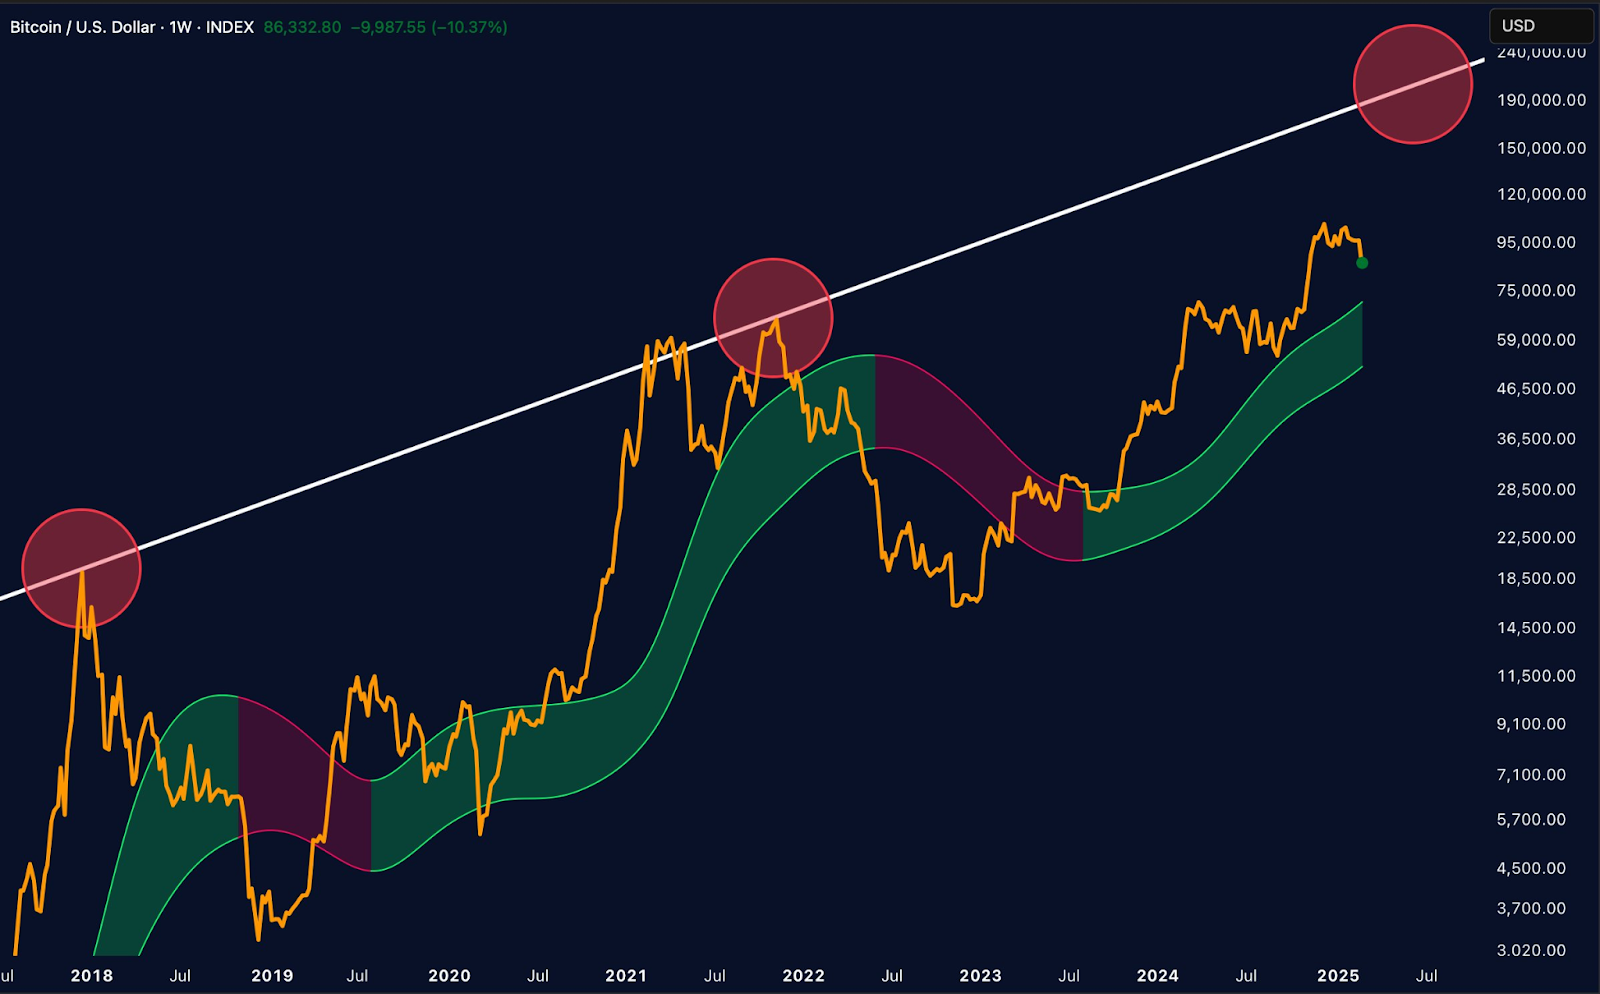
Additionally, a long-term resistance trendline extends across multiple market cycles. It previously rejected BTC in 2017 and 2021, leading to prolonged downtrends. The same trendline now projects a resistance level near $190,000. If historical trends hold, BTC could approach this level before experiencing a correction.
At present, Bitcoin trades around $86,332.80, reflecting a recent decline of 10.37%. However, the price remains above the dynamic moving average ribbon, maintaining bullish structure. If BTC sustains above key Fibonacci levels, another upward push remains likely. The projected price action suggests an extended uptrend following a consolidation phase.