
- XLM is trading at $0.2670 after a 5.61% drop showing strong selling.
- Support between $0.23 and $0.20 could hold if demand builds fast.
- A break below $0.20 could push XLM toward $0.2013 as momentum fades.
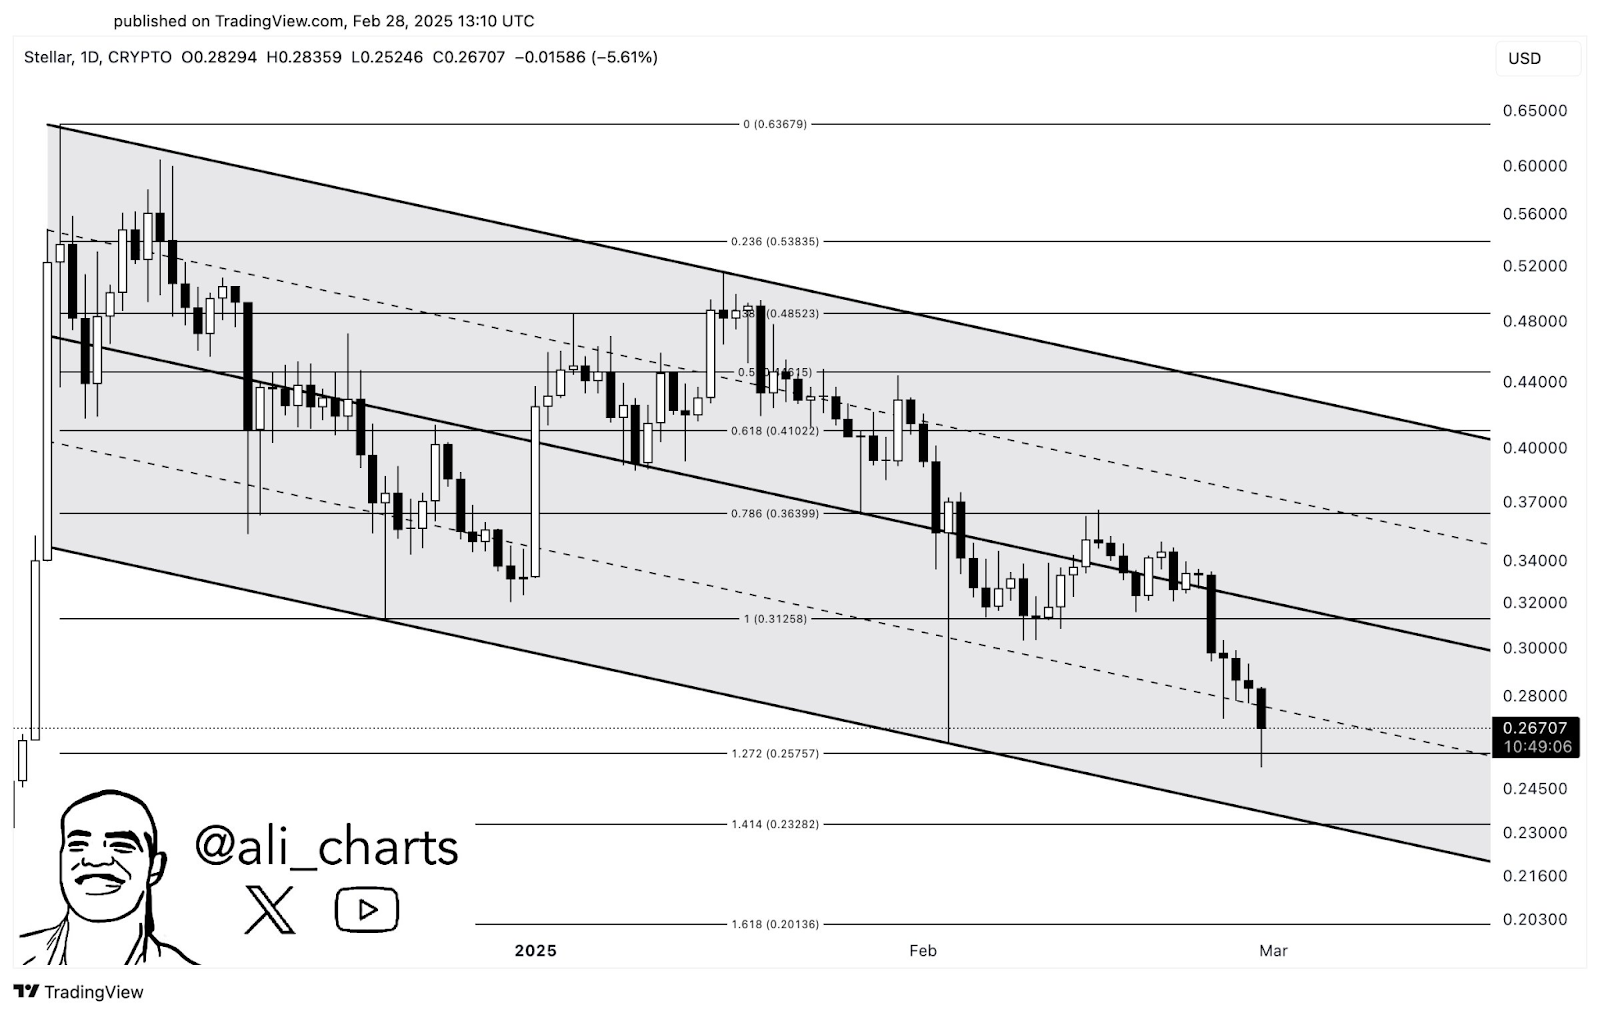
Stellar (XLM) currently trades at 0.2670, showing a downtrend of 5.61%, on its falling channel that has been depicting its price actions for several months. The last daily chart puts forward a frantic selling that has pushed XLM price below several important Fibonacci retracement levels such as the key 0.618 level at $0.4102 and the 0.786 at $0.3839. The price currently floats around the level 1.272 Fibonacci extension at $0.2675, and analysts expect the important levels will be down to $0.23 from there; the price action is set to lower highs and lower lows, making it unlikely that XLM will present itself positively unless buyers take bold interest near those crucial areas.
Fibonacci and Channel Analysis Suggests Lower Support Levels
XLM’s current price structure continues to respect the descending channel, where previous rebounds failed to break above the mid-channel resistance. The Fibonacci sequence on the chart places the next immediate support at the 1.414 extension level at $0.2328, aligning with the analyst’s view that buyers may step in between $0.23 and $0.20.
If this range holds, a short-term bounce could materialize, but sustained weakness may push XLM toward the 1.618 Fibonacci extension at $0.2013. The sell-off remains in line with the broader trend, as XLM has been making successive lower lows since peaking above $0.65 earlier in the cycle.
Bearish Momentum Continues as Price Approaches Key Support
XLM’s latest decline comes amid growing sell-side pressure, with each bounce facing swift rejections at lower resistance levels. The price action has consistently struggled to reclaim lost ground, failing to hold above psychological levels like $0.30. With the latest 5.61% drop, the bearish momentum suggests that traders remain cautious, awaiting clearer signals near support.
Trading volume has yet to indicate strong accumulation, reinforcing the likelihood of further downside if the $0.23 to $0.20 range fails to attract enough buyers. Historical data suggests that these levels could provide relief, but confirmation is necessary before considering a potential reversal.
Potential Scenarios for XLM’s Price Movement
As XLM nears the obvious support range, traders remain obsessed with whether buyers can generate a floor at prices near $0.23. If this level holds, then some relief rallying towards $0.30 is possible; however, strong resistance lies in wait around $0.31 and possibly $0.38.
Alternatively, failure to stabilize in this area might intensify losses to levels around the 1.618 Fibonacci extension at $0.20. XLM remains in a clear downtrend overall; any upward movements will therefore need a lot of buying interest to break above the established bearish structure.